
The number of IPs just keeps on falling, but complaints have increased. What is going on?
In this blog, I explore whether the Insolvency Service’s 2018 report on IP regulation provides the answer. Also, is it just a blip? And could this analysis help with the Service’s recently-issued call for evidence on IP regulation?
The Insolvency Service’s report can be found at: https://www.gov.uk/government/publications/insolvency-practitioner-regulation-process-review-2018
In brief, the report indicates that, in 2018:
- Despite insolvency case numbers increasing, IPs continued to leave the profession
- Actions that most often appeared in RPB sanctions were: poor case progression/closure; faults in administering IVAs; and breaches of statutory filing/reporting requirements
- Only two complaints (of the 381 referred to the RPBs) had been received from creditors! As usual, debtors were the most frequent complainers, but complaints lodged by directors and IPs showed quite an increase
- Over 50% of the complaints lodged at the Gateway did not make it through to the RPBs
- On average, one in three IPs received a complaint, but this figure jumped to more than one in every two for IPA-licensed IPs
- Could this be because the IPA licenses all the IPs in the top six volume IVA provider firms (who registered over 75% of all new IVAs last year)..?
- Over 50% of all complaints referred to the RPBs related to IVAs
Case numbers go up but IP numbers keep on going down
There has been a significant increase in insolvency case numbers over the past 3 years. There were 20% more corporate insolvencies and over 40% more personal insolvencies started in 2018 than the numbers started in 2015. Isn’t now a good time to be in insolvency..?
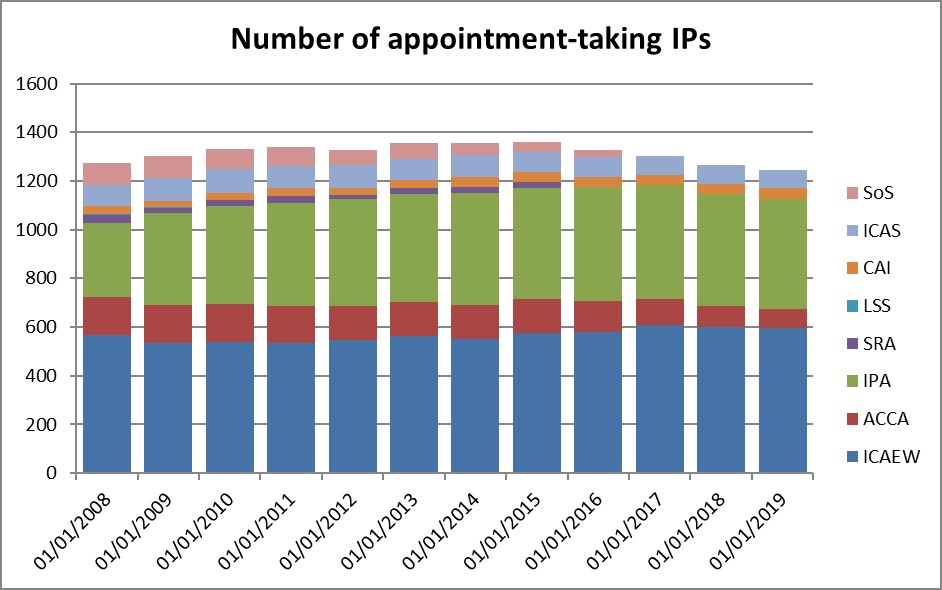
These statistics reflect my personal experience: over the past year, I have known of IPs who have left the profession and they’ve not all been of retiring age. What is happening?
There’s no doubt in my mind that competition has become fiercer. I have seen more occasions of IPs being toppled from offices and the ORs seem all the more reluctant to allow cases to leave their hands. I have also seen some new ambulance-chasers on the field.
I think that small firms are struggling in this market. It seems to me that larger firms seem hungrier to fight for smaller cases than they used to be. In addition, 2018 was not a regulation-light year: it seemed that simply getting GDPR-ready was someone’s full-time job for several months, which was not at all easy for smaller firms to stomach. Recruitment and retention are also difficult for smaller firms: new talent is attracted to big names, big cities, meaty cases and varied portfolios.
Fewer IPs and more cases mean that each IP has on average a larger caseload (or it could be that the IPs are closing them quicker, but from my personal experience, I don’t think this is happening). If insolvency cases continue to increase, which I think is generally expected, then I think case progression is going to become a bigger concern. Of course, IPs can always look to surround themselves with a larger team to deal with their larger caseloads, but we all know that this tends not to happen: in times of plenty, old cases tend to be shelved while people concentrate on the new excitements.
Is case progression already an issue?
The Insolvency Service’s report gives brief descriptions of every RPB sanction issued (including a couple that weren’t even published on .gov.uk – not sure how that happened!). On categorising these summaries, I have come up with the following failures that appear most frequently in the disciplinary sanctions reported:
- 7 case progression / closure issues (including one failure to realise assets and two failures to pay a dividend – not sure if these were delays or entirely overlooked)
- 6 IVA-related faults (not including case progression / closure)
- 6 statutory filing/reporting breaches
- 3 SIP16 breaches
- 3 faults in relation to directors’ RPO claims
- 3 fee-related errors
- 3 confidentiality breaches (perhaps related?)
- 2 PTD-related faults
- 2 SIP2 failures to investigate or to secure books and records
This shows that failing to progress cases promptly or appropriately can get you into hot water. So too can failing to meet the rules on filing and reporting: four of the six instances listed arose because progress reports were not filed on time (or at all).
What are people complaining about?
The Top 3 topics continue to be ethics, poor communication and SIP3 issues, with the latter now counting for 34% of all complaints recorded by subject, up from 25% last year:
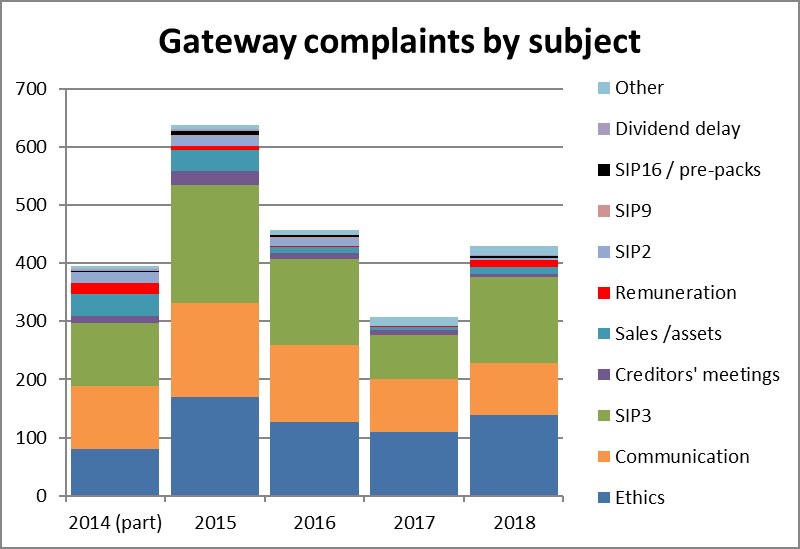
(Note: a complaint may appear in more than one category. There were a total of 381 complaints referred in 2018 – see further below.)
Ok, that’s not a surprise. We all know that the Insolvency Service’s report in September 2018 pulled no punches when it came to the RPB-monitoring of volume IVA providers. It is also unsurprising that people are not directly complaining about late or missing progress reports, but as the sanctions demonstrate, if a statutory filing/reporting breach is identified in the course of the RPB’s investigations into a complaint, don’t be surprised if this is added to your charge sheet.
What we should perhaps be a little concerned about is that complaints on areas that attract a lot of negative press and criticism – SIP16/pre-packs and remuneration – have increased. True, they still pale into insignificance when compared with the total number of complaints (they account for only 16 of the 429 complaints recorded by subject), but this is quite a jump from the one complaint in 2017.
Who is complaining?
I think this shows an interesting shift:
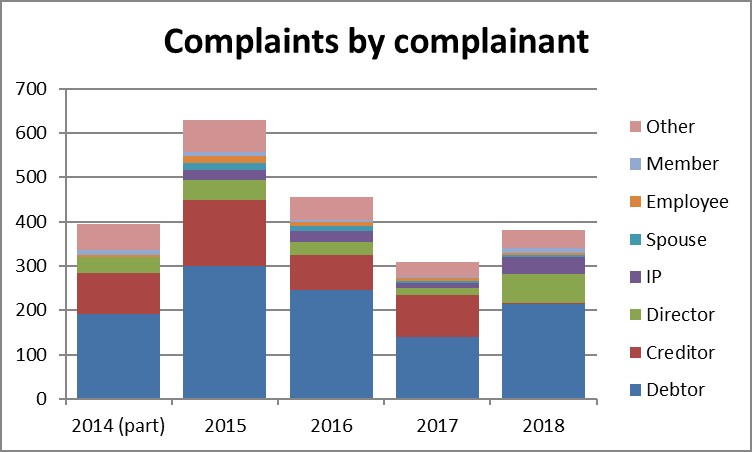
With IVAs featuring so heavily in complaints, it is not surprising that debtors are the most frequent complainant. More bankruptcies were complained about in 2018 too (up from 31 to 75), which no doubt contributed to the increase in complaining debtors.
What I found interesting was that very few creditors complained last year – only two! Even if we add in complaints from employees, this only comes to seven. However, the number of complaints lodged by IPs more than trebled to 38. Ok, this is still a relatively small number, but I think it hints at an interesting development in self-regulation: RPB monitors may only visit you once every 3 years or so, but your peers are watching you all the time!
How many complaints get through the Gateway?
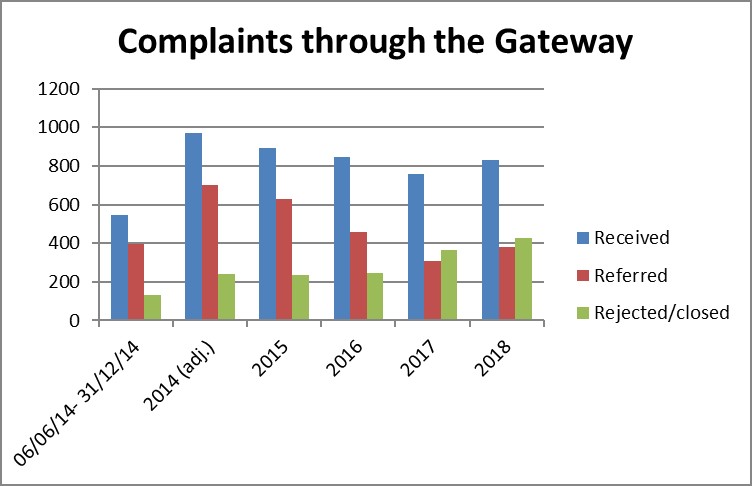
(Note: the Gateway started in June 2014, so I have pro rated the partial 2014 figure to estimate for a full year.)
Complaint numbers are back up to the 2016 level: in 2016, 847 complaints were lodged and in 2018 the number was 830. However, many more complaints fail to make it through the Gateway. In fact, every year, the number rejected/referred has increased, even though the trend in complaint numbers shows an overall decrease. In 2017, 48% of complaints were rejected or closed and this percentage increased to 52% last year.
Why are complaints not making it through the Gateway?
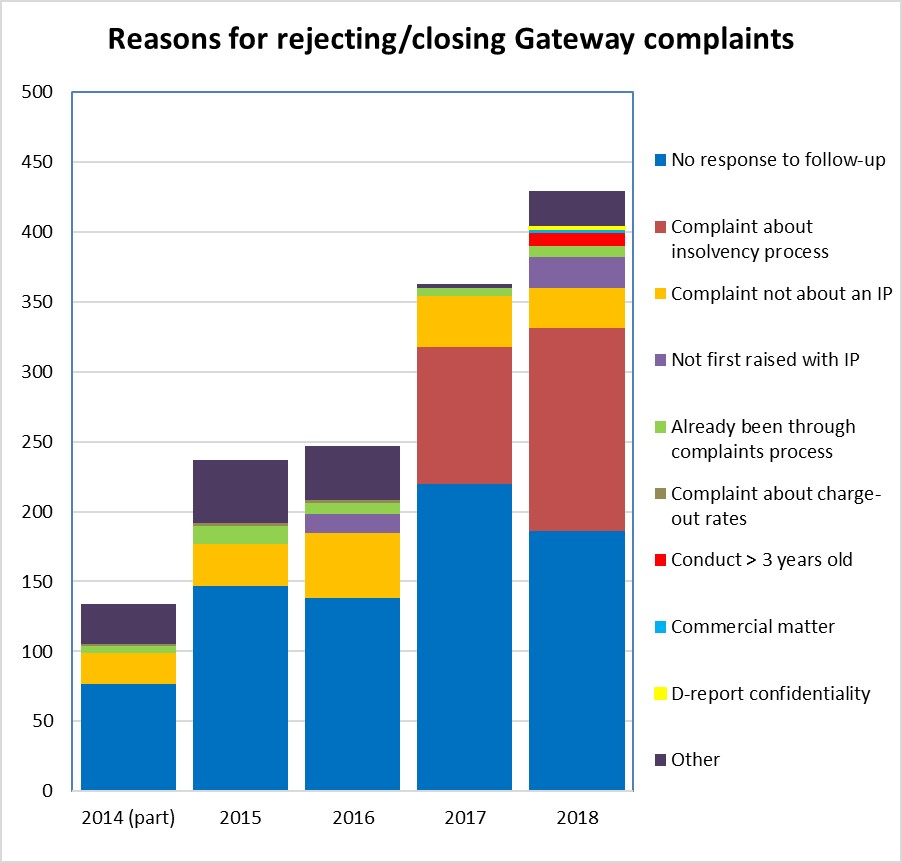
In their 2018 report, the Insolvency Service added a number of new reasons for rejection/closure, which personally has helped me to understand the operation of the Gateway better. For example, I hadn’t appreciated that complaints about conduct that happened over 3 years ago are rejected.
This graph also demonstrates that a large number of complaints (145) – and a great deal more than in 2017 – are rejected because the complaint is about the insolvency process. Again, given that most complaints are lodged by debtors and directors, this perhaps indicates that in many cases IPs may be upsetting the right people. But it might also suggest that some IPs could do a better job of explaining the consequences of insolvency.
What are an IP’s chances of receiving a complaint?
Yes I know that some IPs work in a field that is more likely to attract criticism, but on average how many IPs received a complaint last year and does this average change much depending on one’s licensing body?
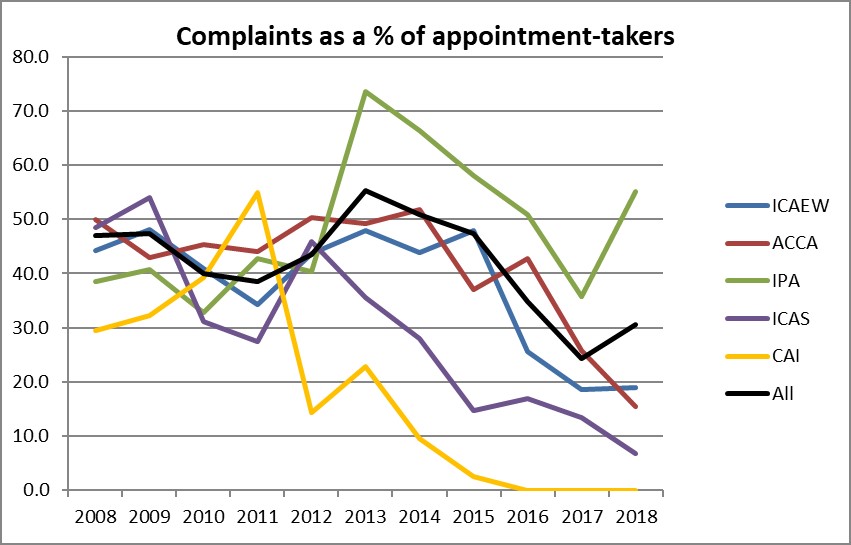
This shows that, generally speaking, one out of every three IPs receives a complaint. Of course, this assumes that complaints are only about appointment-takers and that complaints are evenly spread about.
However, it also shows a large range in averages across the RPBs, with less than one in five IPs for all except the IPA, which shows an average of over one complaint for every two IPs.
The IPA has publicised that “the majority of IPs who work on IVAs are regulated by the IPA” (IPA press release 29/11/2018)… although, as the IPA does not license the majority of all IPs, a large proportion of which will have at least one IVA, presumably they’re meaning those who do IVAs in volume. Does this, along with the graph above, mean that volume IVA providers disproportionately feature in complaints?
How many Volume IVA IPs does the IPA license?
The Insolvency Service now publishes data on new IVAs per firm: https://www.gov.uk/government/statistics/individual-voluntary-arrangement-outcomes-and-providers-2018, which helped me out with this question.
An analysis of this list shows that the IPA licenses all the IPs registered at the Top 6 firms. These firms alone account for over 75% of all IVAs registered in 2018. Even if we look at the whole list of Top 14 firms (two of which no longer exist!), the IPA licenses 25 of the 33 IPs registered at these firms (with the ICAEW licensing 3 and ICAS the remaining 5, all 5 of which are located at the one firm).
So clearly then, the IPA’s complaints figures are bound to be affected by the number of IVA complaints lodged. But this assumes that IVAs count for a large proportion of complaints. Is this true?
How many IVAs are being complained about?
The following graph compares the number of IVA complaints with those about other matters:
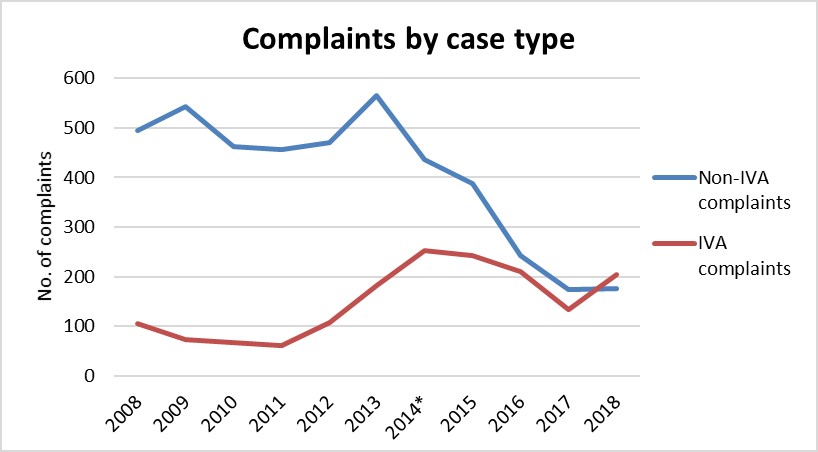
(Note: the Gateway started in June 2014. The way complaint numbers were published by case type then changed from those recorded by the RPBs to those referred to the RPBs from the Gateway.)
So for the first time, last year there were more IVA complaints than there were complaints about all other matters/case-types combined. It’s no wonder therefore that the IPA has recorded many more complaints per IP than any other RPB and it’s not surprising that the IPA has sought to recruit more regulatory staff… and that they have warned IPA members that fees may be increasing this year!
I appreciate that the Insolvency Service did (finally!) wake up to some of the issues around regulating volume IVA providers last year and I accept that the IPA has made some public announcements about how they have been working towards changing their monitoring regime for the IPs in these firms. However, as someone who has spent the last few years almost exclusively helping IPs in “traditional” insolvency practices, I do wonder if a disproportionate amount of time has been spent by the regulators (and government and the press) in criticising, legislating and threatening to legislate to remedy other apparent ills of the insolvency profession.
Is the solution a change in regulatory approach?
Interestingly, the Service’s just-released call for evidence on IP regulation (pg 15 of the doc at https://www.gov.uk/government/consultations/call-for-evidence-regulation-of-insolvency-practitioners-review-of-current-regulatory-landscape) focuses in on the different firm structure that exists in some IVA specialists where the IP is an employee. This leads them to ask the question of whether firm-regulation, rather than individual IP-regulation, may be more appropriate in some sectors. While I think that the Service definitely has a point, I do think that there are other fundamental differences in “volume IVA providers” – the hint is in the name – that also demand a fundamentally different regulatory approach.
In my next blog post, I’ll look more closely at complaint – and monitoring – sanctions.