
My annual review of the Insolvency Service’s 2017 IP regulation report has thrown up the following:
- The number of IPs drops again – the third year in a row
- But good news: 2017 saw half as many complaints referred through the Gateway as 2015
- This may be partly due to the Insolvency Service’s sifting process: almost half of all complaints put to the Gateway in 2017 were sifted out
- Sadly, despite the overall reduction, there were more sifted-in complaints from creditors in 2017 than in the previous year
- The RPBs seem to be generating more complaints sanctions: 10 years’ ago, 1 IP in 100 could receive a complaints sanction; now it is c.1 in 20
The Insolvency Service’s report can be found at: https://tinyurl.com/ycndjuxz
IPs leaving the profession
As the following graph shows, the number of appointment-taking IPs has fallen for the third year in a row:
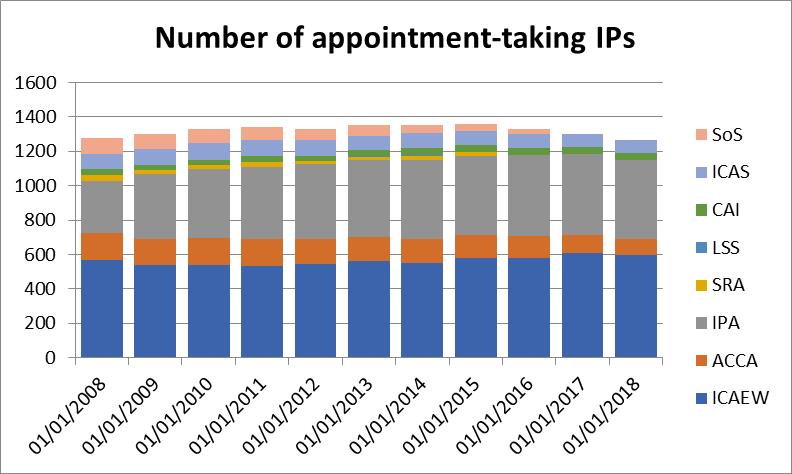
In ICAS’ 2017 monitoring report (https://www.icas.com/regulation/insolvency-monitoring-annual-reports), that RPB puts the decrease down to the number of IPs who have retired, which I suspect is probably the case across the board. And we’re not seeing their number being replaced by new appointment-takers. I can’t say I’m surprised at that either: regulatory burdens and personal risks continue to mushroom, formal insolvency cases (especially those with assets) appear more sparse and the media has nothing good to say about the profession. Why would anyone starting out choose formal insolvency as their career choice?
Admittedly, it’s not an alarming fall… not yet… but one has to wonder how the Insolvency Service proposes to address this trend, given that one of their regulatory objectives introduced in 2015 was to encourage an independent and competitive profession.
But what is life like for current IPs? Is there no good news?
Another dramatic fall in complaints
Much more striking is the fall in the numbers of complaints referred to the RPBs:
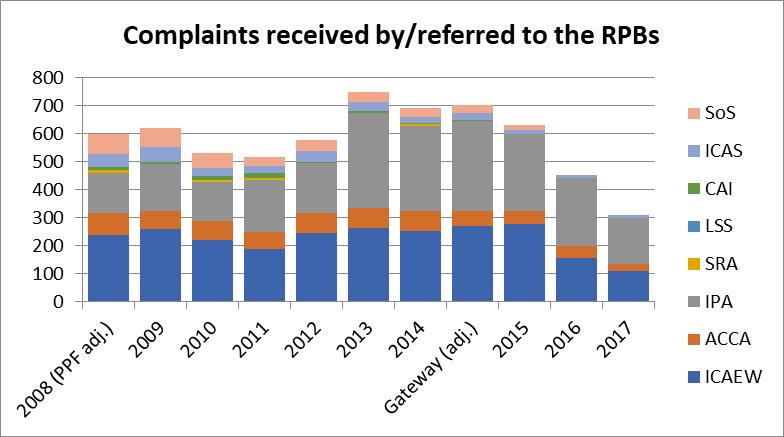
No one – the Insolvency Service, RPBs or R3 – is shouting about this good news: the fact that the complaint number has halved since 2015, the first full year of the Complaints Gateway’s operation? I would have thought that the InsS could have easily spun it into a story about the success of the Gateway or of their policing of insolvency regulation generally, no? 😉
Where are the rem and pre-pack complaints?
I wonder if the subject matter of the complaints is one reason why the InsS may not be keen to draw attention to complaints trends.
The following analyses the complaints put through the Gateway:
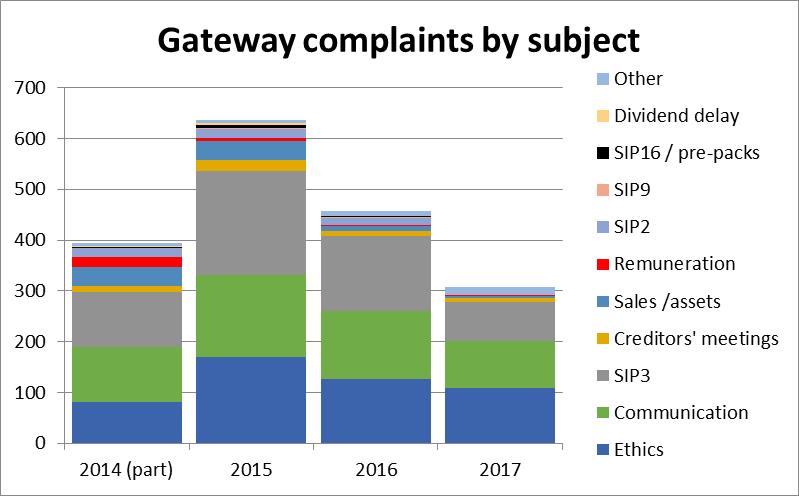
If we were asked what areas of apparent misconduct we thought were the top of the InsS’s hit-list, I suspect most of us would answer: IP fees and pre-packs. But, as you can see, these two topics have never featured large in complaints.
Despite the fees regime becoming more and more complex and involving the delivery of more information and rights to creditors to question or challenge fees, you can see that the complaints about fees have dropped: there were 19 in 2014 and only one last year. And last year, there were no complaints about pre-packs.
This graph demonstrates what might be behind the drop in complaint numbers: there is a marked decrease in complaints about SIP3 and communication breakdowns. I think that’s certainly good news to shout about.
So in what areas could we perhaps try harder to avoid attracting complaints?
Complaint danger zones?
The following analysis supports the perception that IVAs are attracting fewer complaints than in recent years, although IVAs are still number one. In fact, it demonstrates that all insolvency proceedings are attracting fewer complaints.
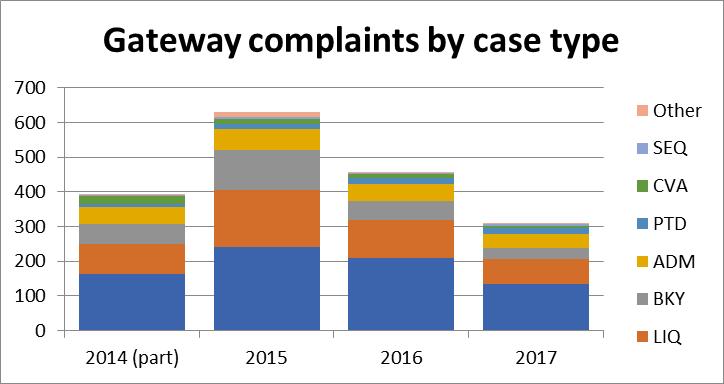
However, when looked at as a percentage of complaints received…
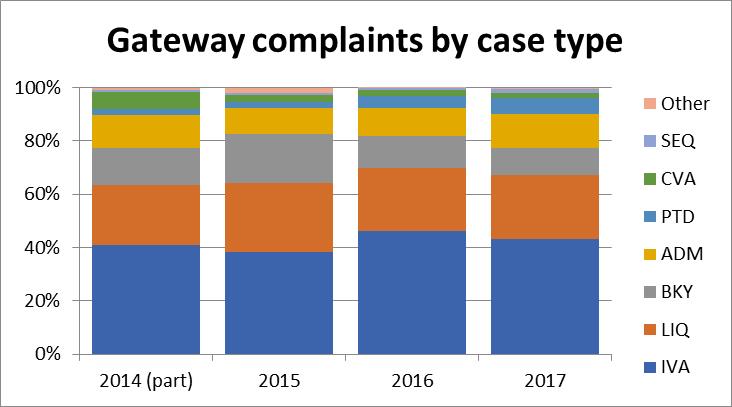
… it would seem that complaints about ADMs and PTDs aren’t dropping quite as quickly as those for other processes. Putting the two analyses together leads me to wonder whether ethics-related complaints involving ADMs now form a disproportionately large category of complaints, particularly in view of the relatively small number of ADMs compared with IVAs and LIQs. Press coverage would also appear to support this area as a growing concern.
Creditors are lodging more complaints
The following graph gives us a little more insight into the origin of complaints:
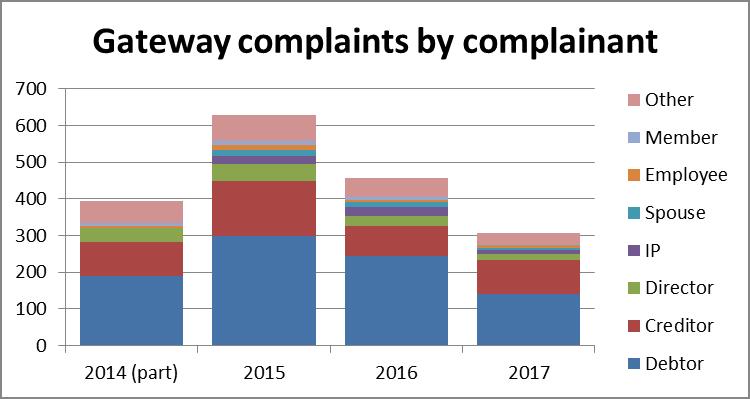
This shows that creditors are the only category of complainant that has seen an increase in the number of complaints lodged over the past year. Could the profession do more to help creditors understand insolvency processes and especially ethics?
The Insolvency Service has reported for a few years now that the Insolvency Code of Ethics has been under review. As we know, the JIC/RPBs launched a consultation on a draft Code last year – the consultation closure date has almost hit its anniversary! The InsS 2017 review reported that a revised Insolvency Code of Ethics “is expected to be issued later this year”. It seems to me that a fresh and clear revised Code could help us address the number of complaints lodged.
Not every complaint is a complaint
I highlighted last year that it seemed the InsS had been sifting out a greater number of complaints as not meeting the criteria for referring over to the relevant RPB. This shows how that trend has developed:
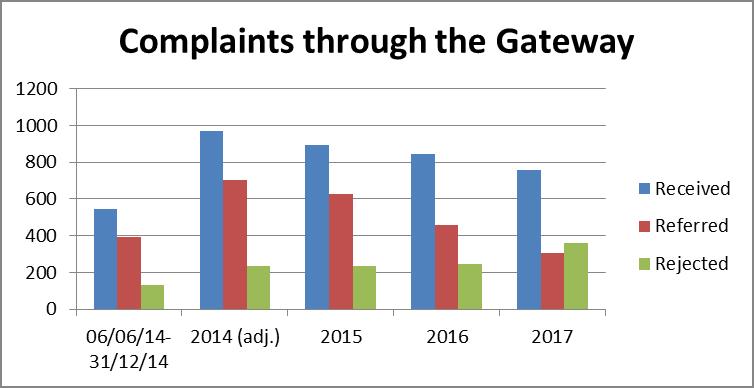
Wow! So for the first time, the InsS rejected more complaints that it referred: almost half of all complaints were rejected (48%) and only 41% were referred. Compare this to the first few months of the Gateway’s operation when only 25% were rejected and 72% were referred. Nevertheless, setting aside the number of rejected complaints, it is good to see that even the trend for the number of complaints received is a nice downwards slope. And in case you’re wondering, I suspect that the remaining 11% of complaints received are still being processed by the IS – a fair old number, but pleasingly a lot less than existed at the end of 2016.
Of course, the Gateway is still relatively young and it is good to read that the InsS is continually refining its sifting processes, as can be seen from the following graph:
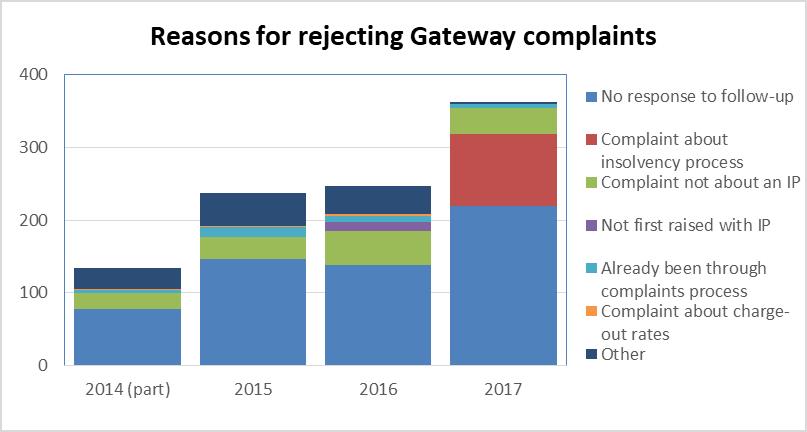
This indicates that a large part of the increase in rejected complaints is because more complainants have not responded to the Insolvency Service’s requests for further information.
For 2017, the Insolvency Service added a new category of rejections: complaints that were about the effect of an insolvency procedure. Although there will always be some creditors and debtors who complain about the fairness of insolvency processes, perhaps an unintended benefit of the Complaints Gateway is that the InsS receives first-hand expressions of dissatisfaction about the design of the insolvency process… although let’s hope the InsS considers using such intelligence to amend legislation where sensible, rather than try to force IPs to fudge legislative flaws via Dear IPs and the like.
You might expect that, as the Insolvency Service rejects more complaints, so the percentage of sanctions arising from complaints that make it past the sifting process should increase.
Roughly one complaint out of every five results in a sanction
Well, you’d be right.
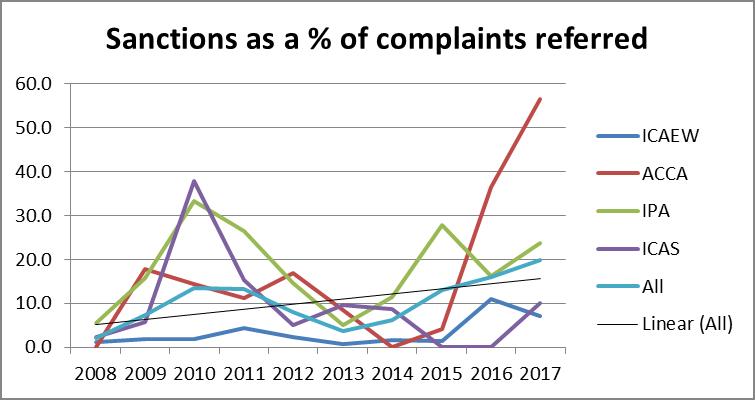
The trendline here suggests that a complaint was twice as likely to end up in a sanction in 2017 as it was 10 years’ ago.
You might be wondering what is going on with ACCA-licensed IPs: how can over half of their complaints result in a sanction compared to an average elsewhere of around 10-20%?!
I agree that the figures are odd. However, it should be remembered that complaints are not always closed in the year that they are opened. And in this respect, the ACCA’s stats appear particularly odd. For example, in last year’s InsS report, it was stated that the ACCA had only one 2013 complaint remaining open, but in this year’s report, apparently there are now thirteen 2013 open complaints against ACCA-licensed IPs! The ACCA went through some enormous changes last year, as their complaints-handling and monitoring functions were taken over by the IPA with effect from 1 January 2017. Could this structural change be behind the unusual stats? Or perhaps the ACCA had been handling some particularly sticky complaints in 2014 and 2015, when their sanctions were low, and those investigations have now come to fruition.
The same effect of sanction clustering could be operating within the other RPBs in view of the spiky lines above. Therefore, perhaps it would be wise to avoid drawing conclusions about apparent inconsistencies between RPBs’ complaints processes based on 2017’s figures alone. However, averaging out the figures over the past three years, we can see that 23% of complaints against IPA-licensed IPs resulted in a sanction, whereas only 5% of complaints against ICAEW-licensed IPs did so. I believe that the IPA licenses more than its fair share of IVA-specialists, so this might account for at least some of the difference.
Increased sanctions are not just a Gateway-sifting effect
But what about my suggestion above: that the increased number of sifted-out complaints has led to a larger proportion of complaints allowed through the Gateway leading to a sanction?
That’s not the whole story:
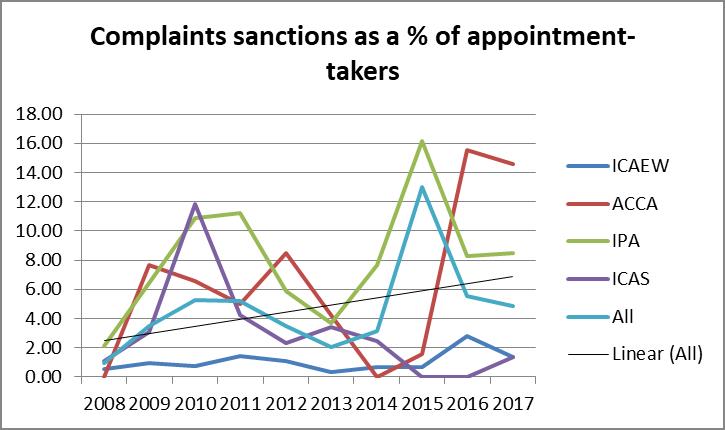
This shows that the number of complaints sanctions per IP has also been on an upward trend: around 1 in 100 IPs received a sanction in 2008, whereas this figure was closer to 1 in 20 in 2017.
What is behind this trend? I really don’t believe that it’s because more IPs now conduct themselves in ways meriting sanctions (or because there are a few IPs who behave badly more often). And as we’ve seen, the number of complaints lodged doesn’t support a theory that more people complain now.
It must be because expectations have been raised, don’t you think? Or perhaps because the increased prescription in rules and SIPs has led to more traps?
Hidden measuring-sticks?
For example, the InsS report describes one IP’s disciplinary order, stating that the IP had breached SIP16 “by failing to provide a statement as to whether the connected party had been made aware of their ability to approach the pre-pack pool and/or had approached the pre-pack pool and whether a viability statement had been requested from the connected party but not provided”. Firstly, SIP16 doesn’t strictly require IPs to state whether connected parties have been made aware of the pool. Secondly, SIP16 states that the SIP16 Statement should include “one of” two listed statements, only one being whether the pool had been approached. Yes, I’ll accept that it seems the IP did not provide information on the existence of a viability statement, although I would have thought that, if a copy of a viability statement were not provided with the SIP16 Statement, then surely the likelihood is that the IP was not provided with one.
I appreciate I am splitting hairs here, but if a SIP is not crystal-clear on what is required of IPs, is it any wonder that slip-ups will be made? And if a disciplinary consent order were generated every time an IP had omitted to meet every last letter of the SIPs and Rules, then I suspect no IP would be found entirely blameless. Ok yes, there exists a mysterious fanaticism around SIP16 compliance and we would do well to check, check and check again that SIP16 Statements are complete (and hang the cost?). However, I think this demonstrates how standards have changed: 10 years’ ago, would an IP have been fined £2,500 and have his name in lights for omitting one line from a report (hint: SIP16 began life in 2009)?
In my next blog, I’ll explore the RPB statistics on monitoring visits.