
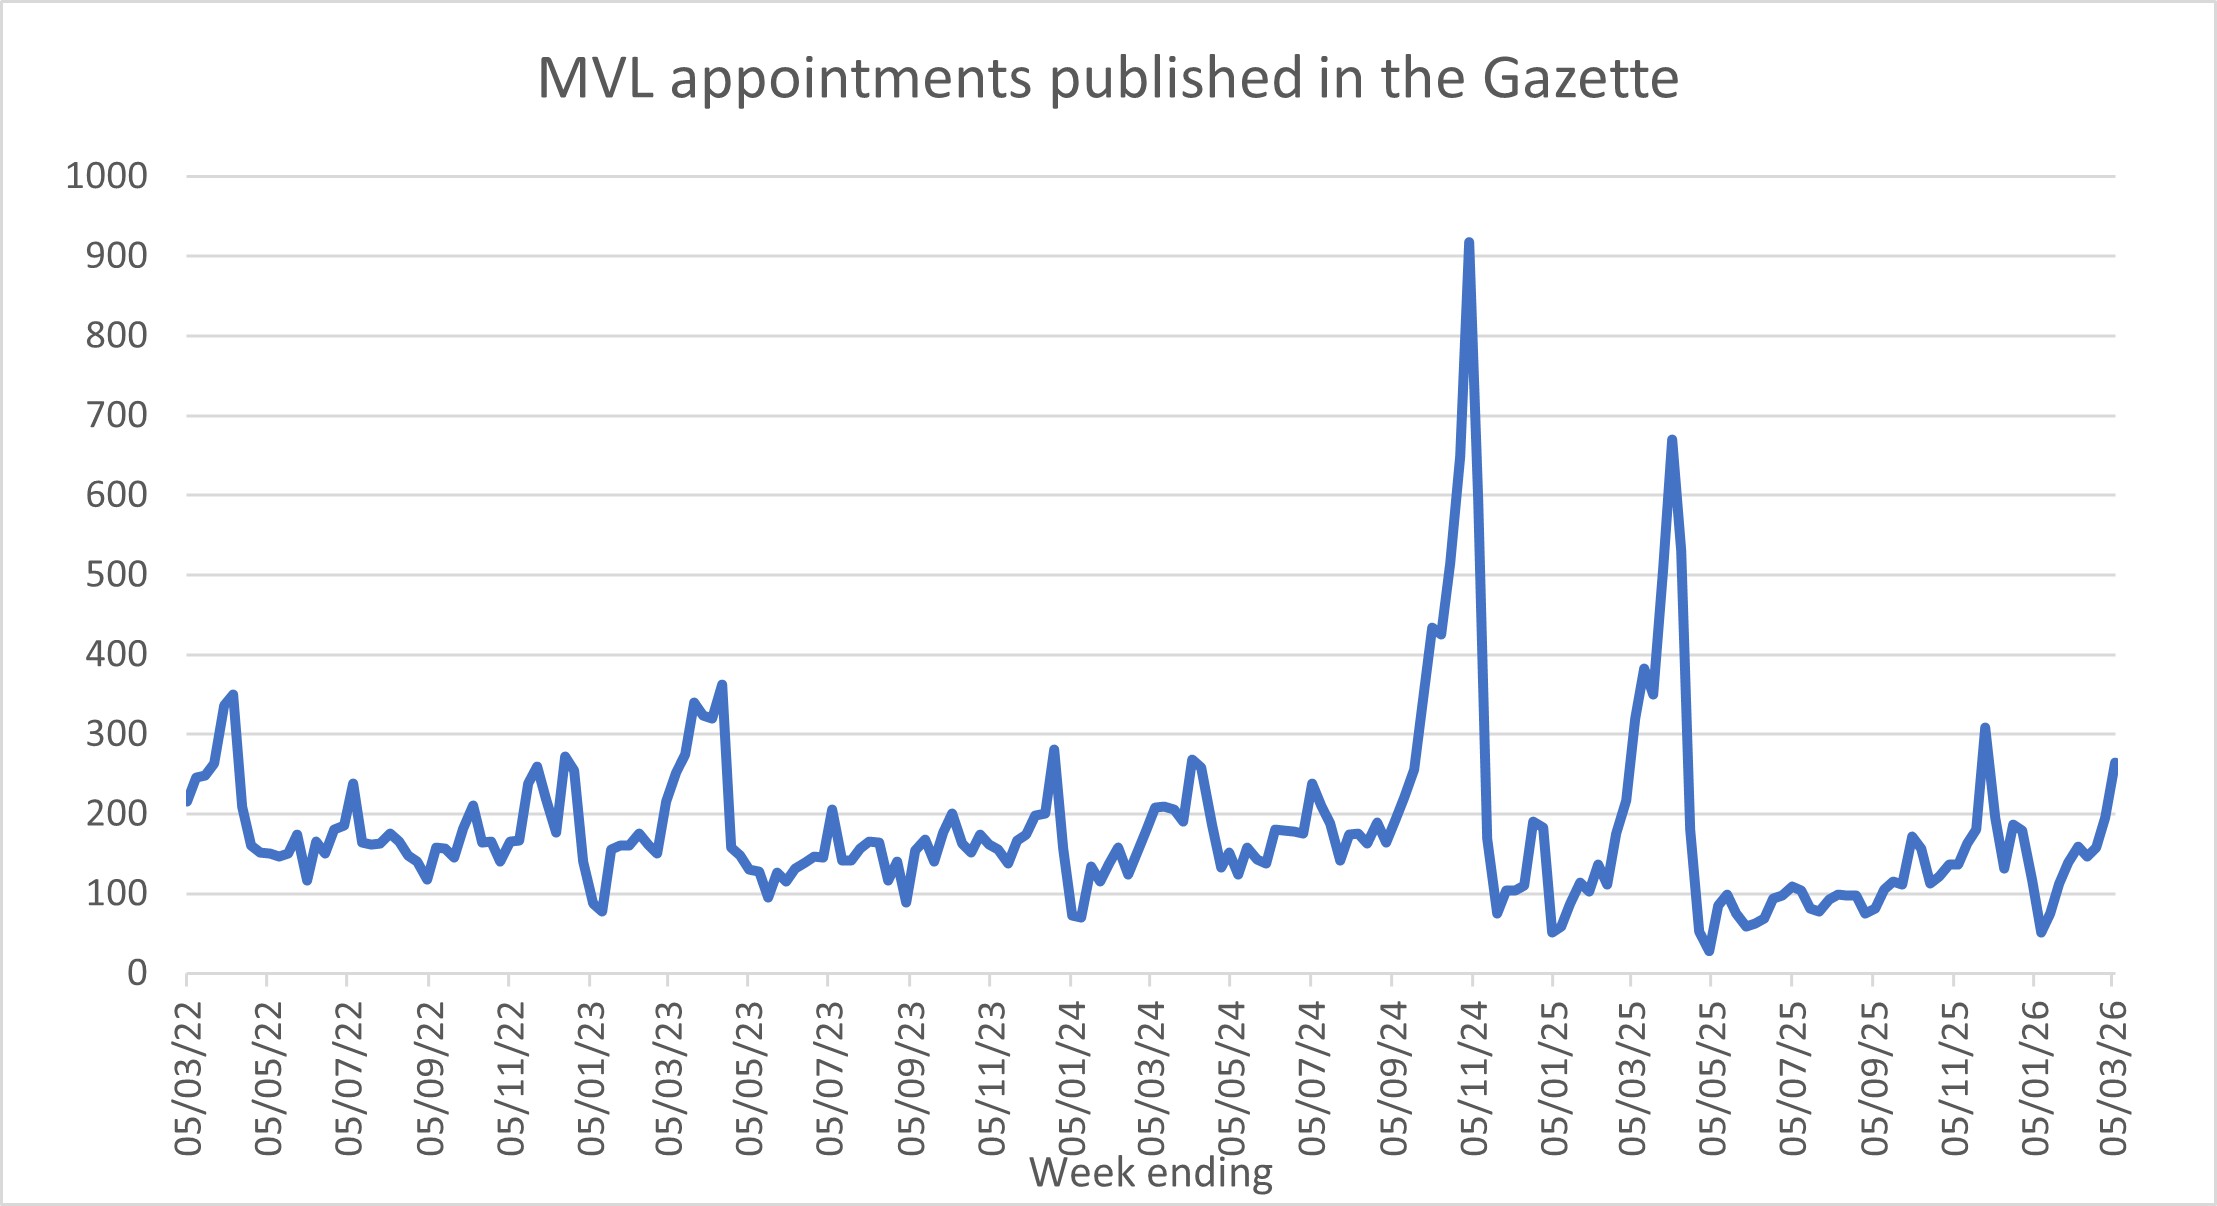
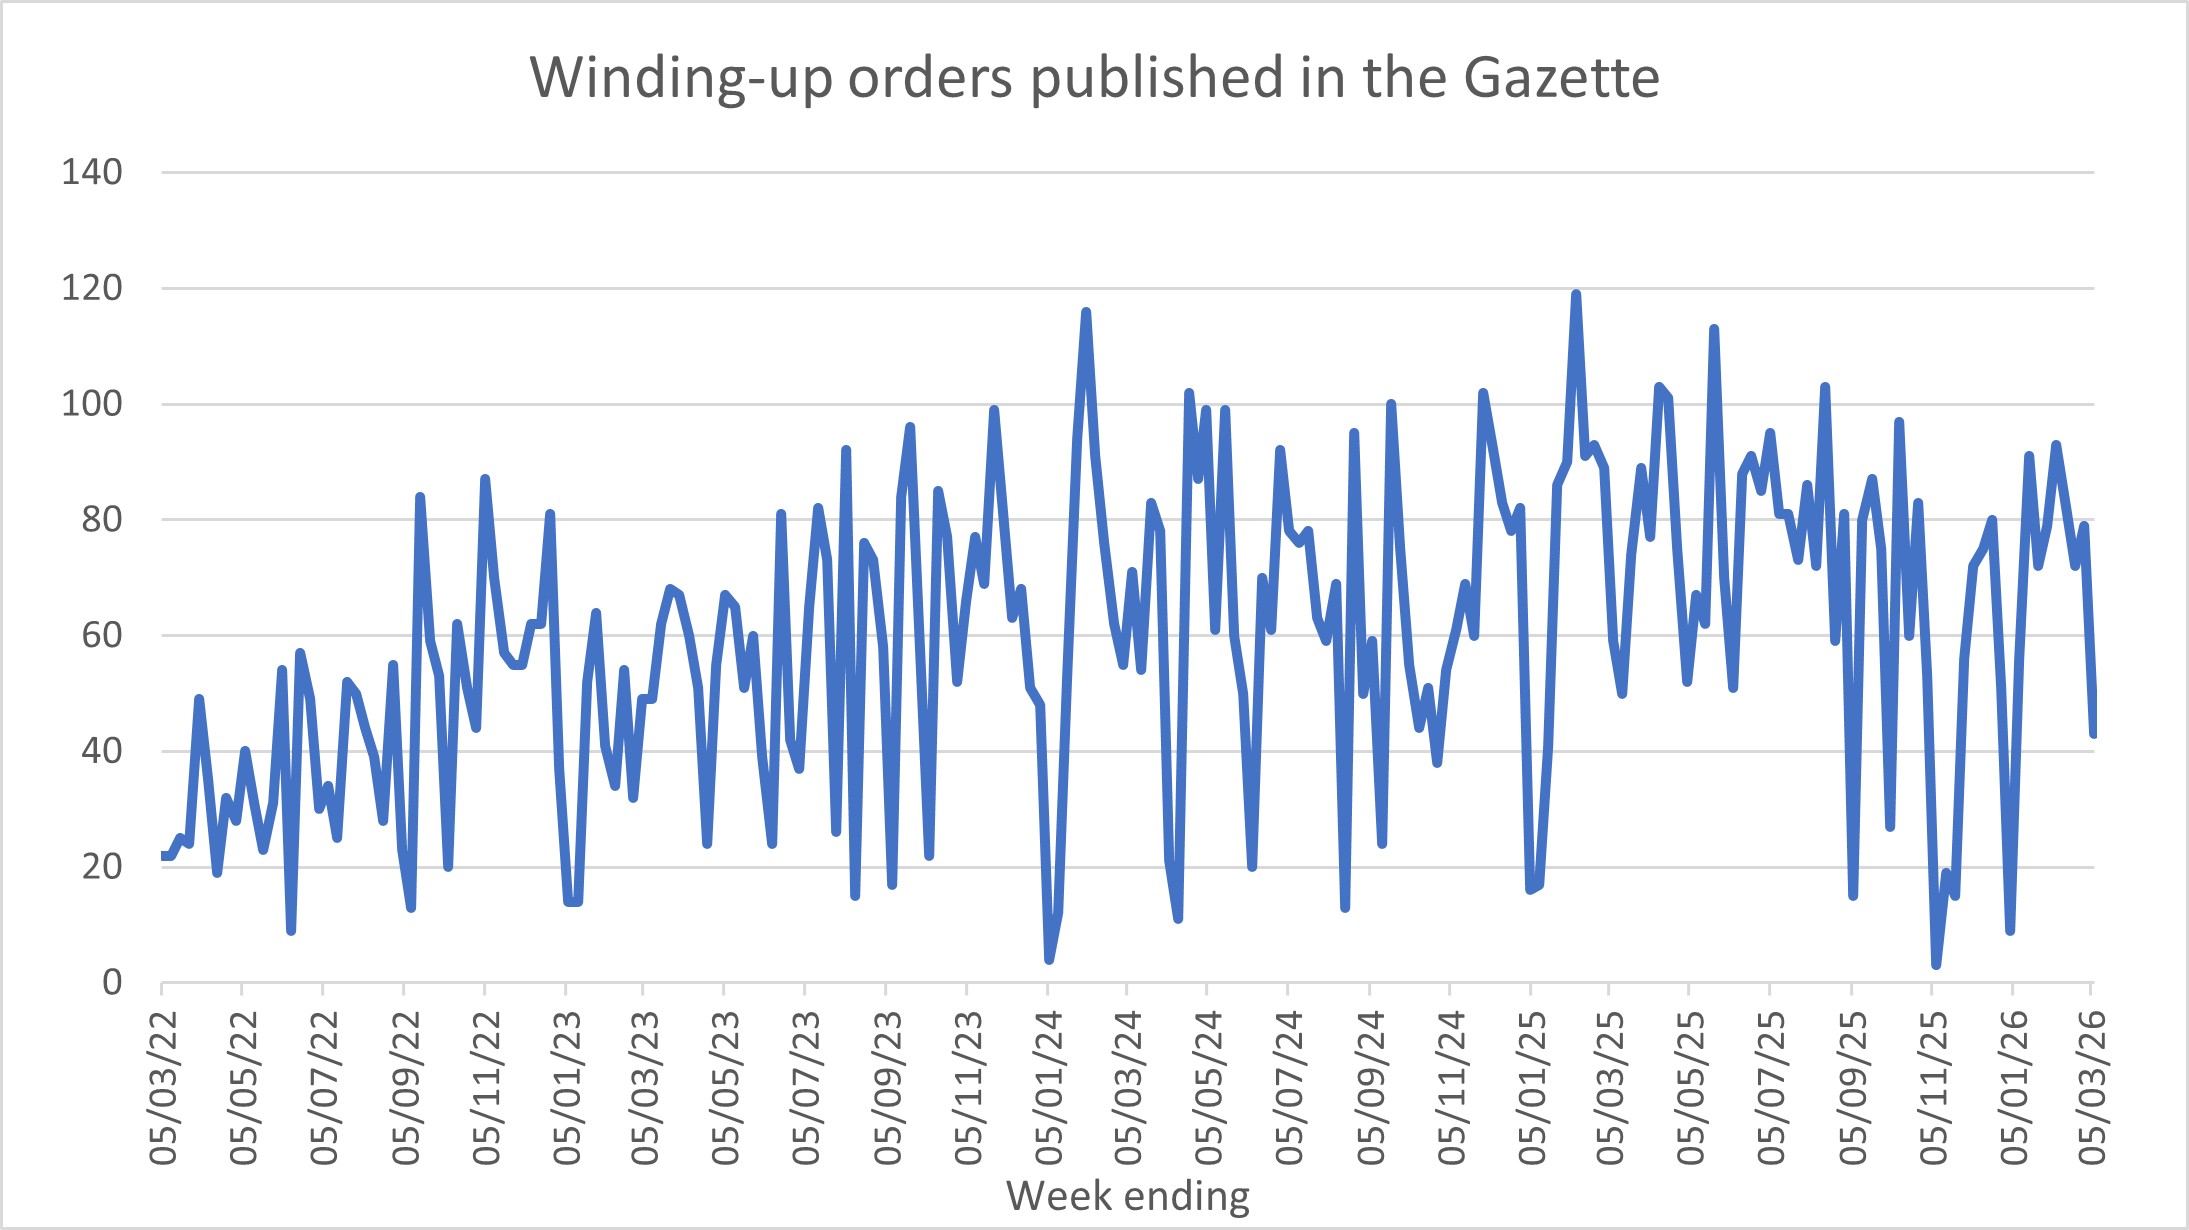
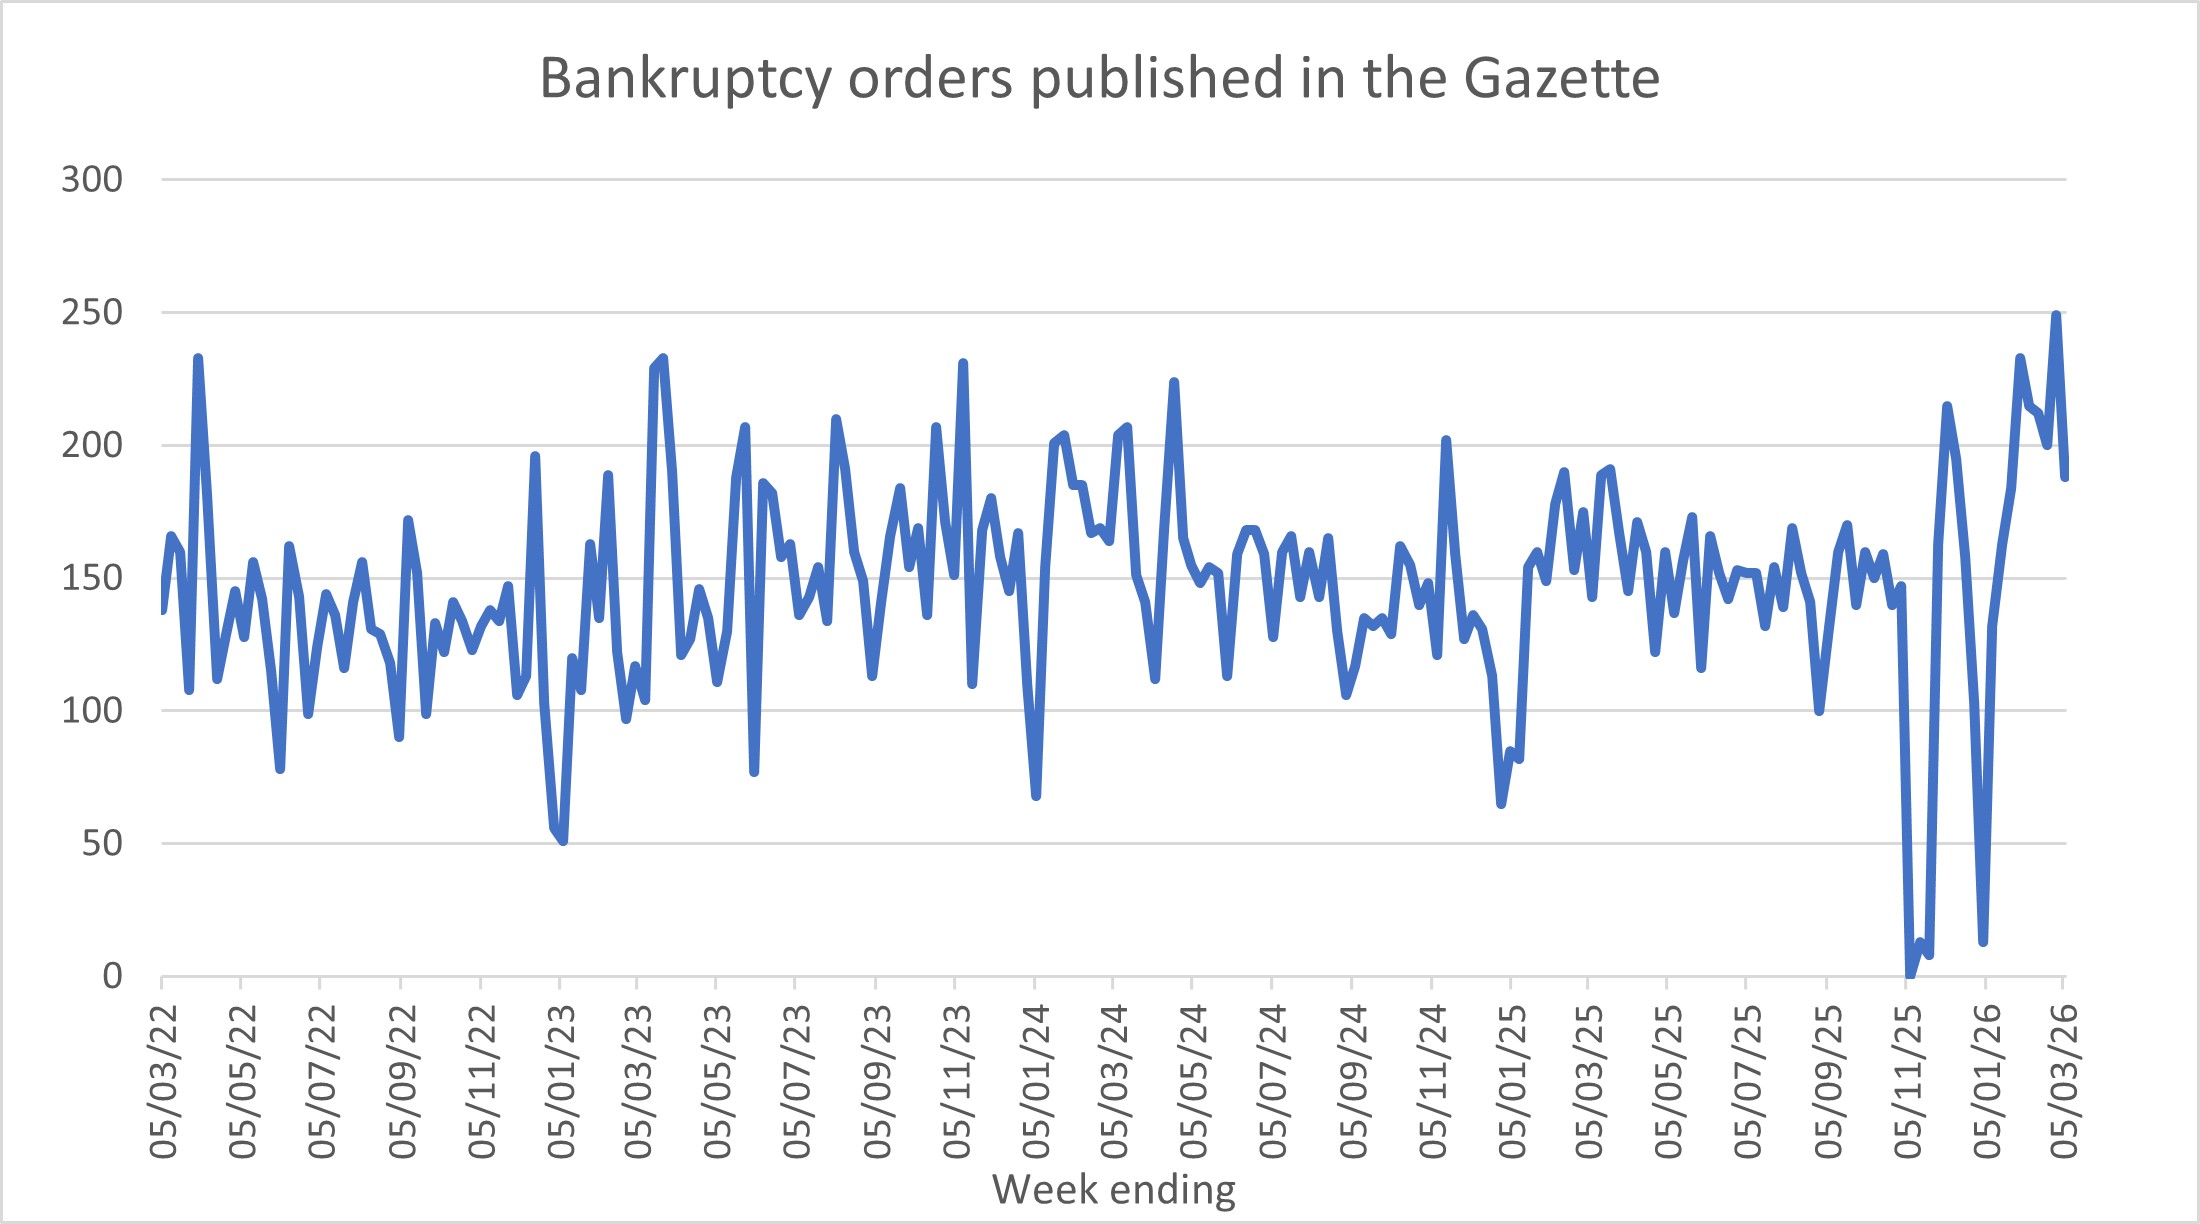
The following graphs show the numbers of notices of appointment published in the Gazette on a weekly basis. Therefore, they likely lag a week or so behind the actual dates of appointment. The graphs are updated each week.
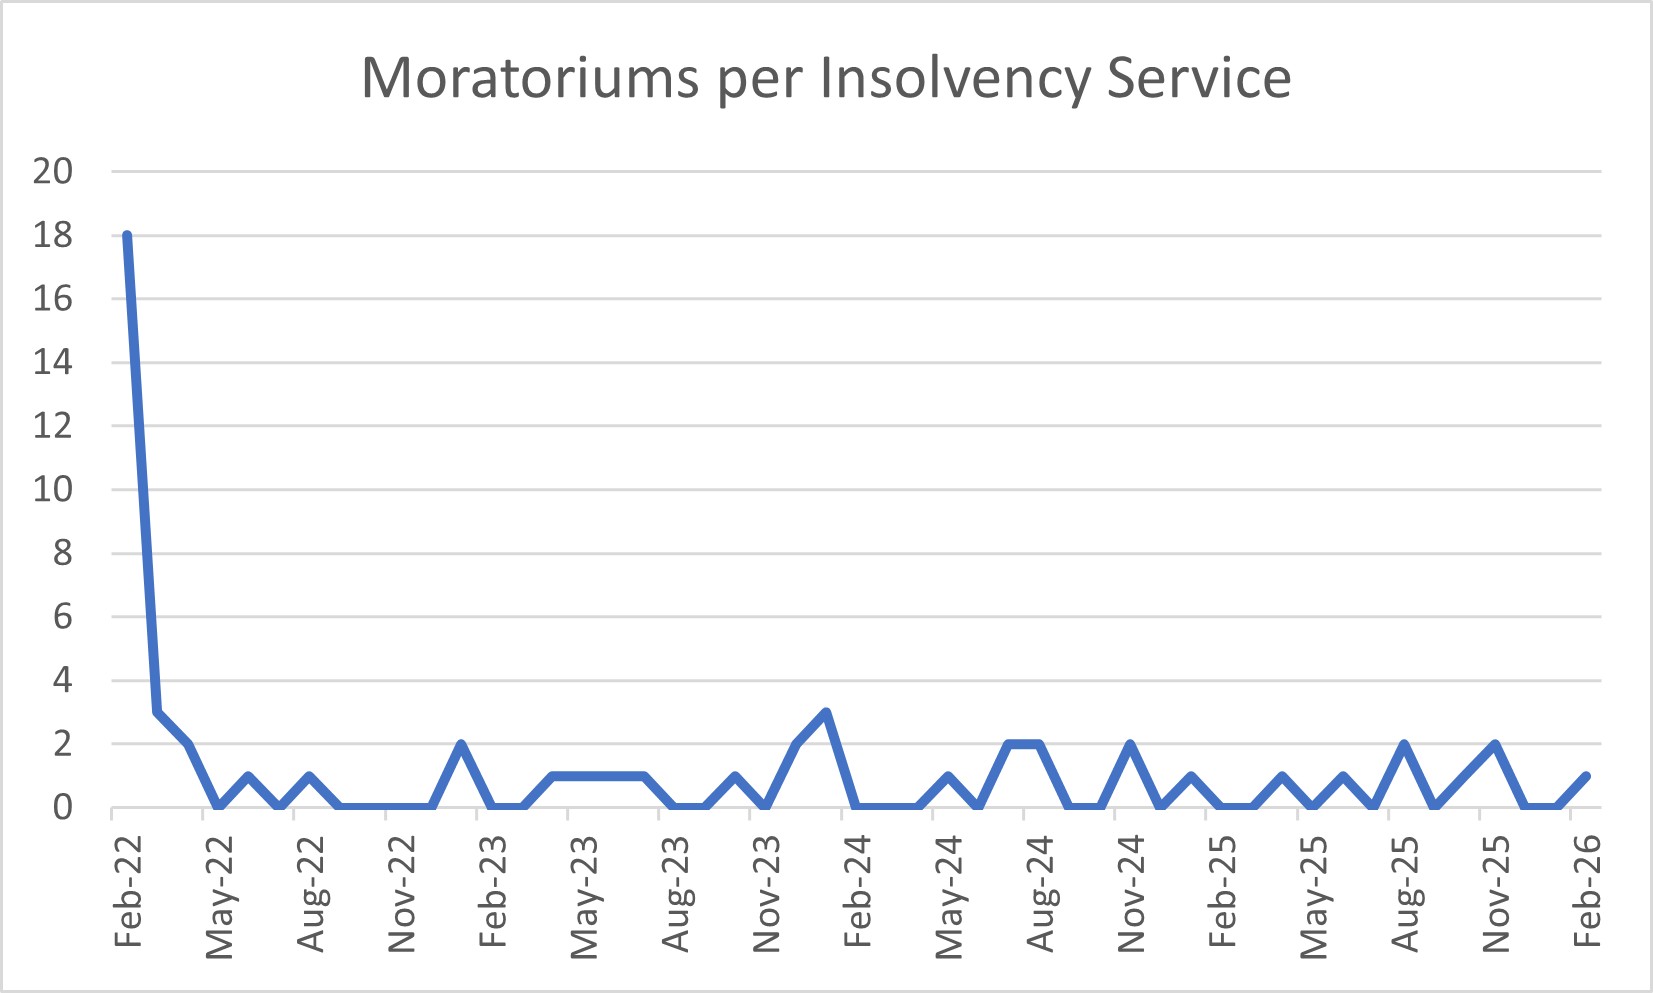
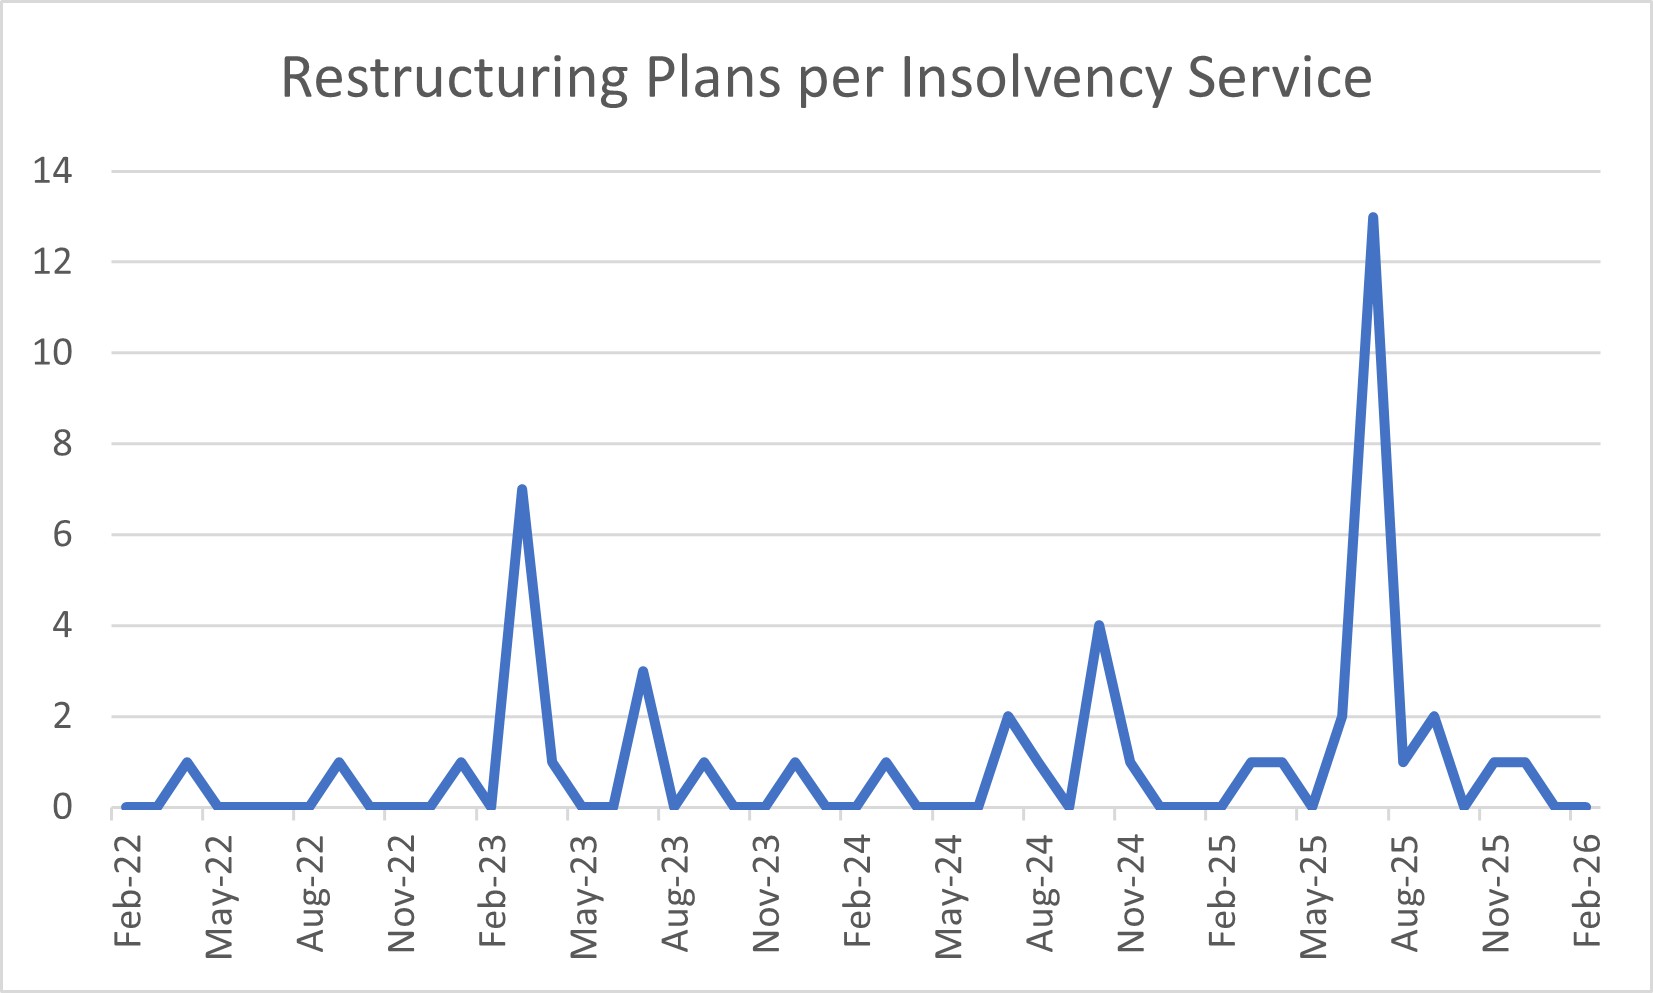
Although there are very few moratoriums and restructuring plans, I thought I might as well provide graphs for those too. I have drawn the data for these from the Insolvency Service’s monthly statistics.
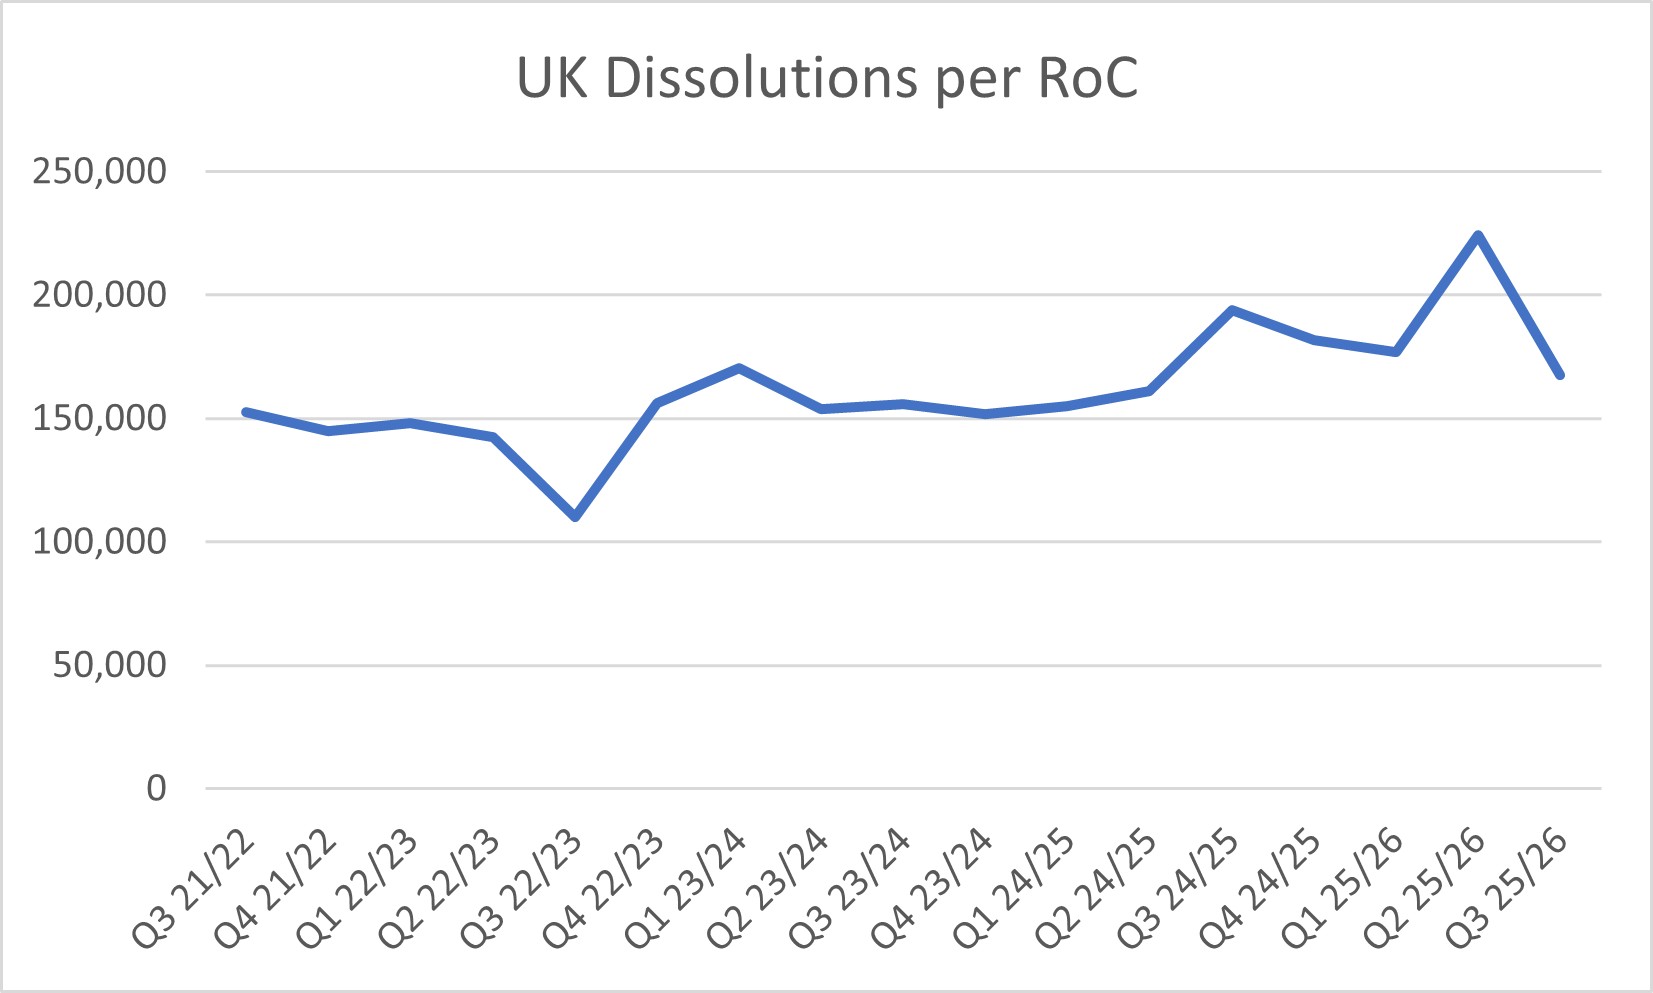
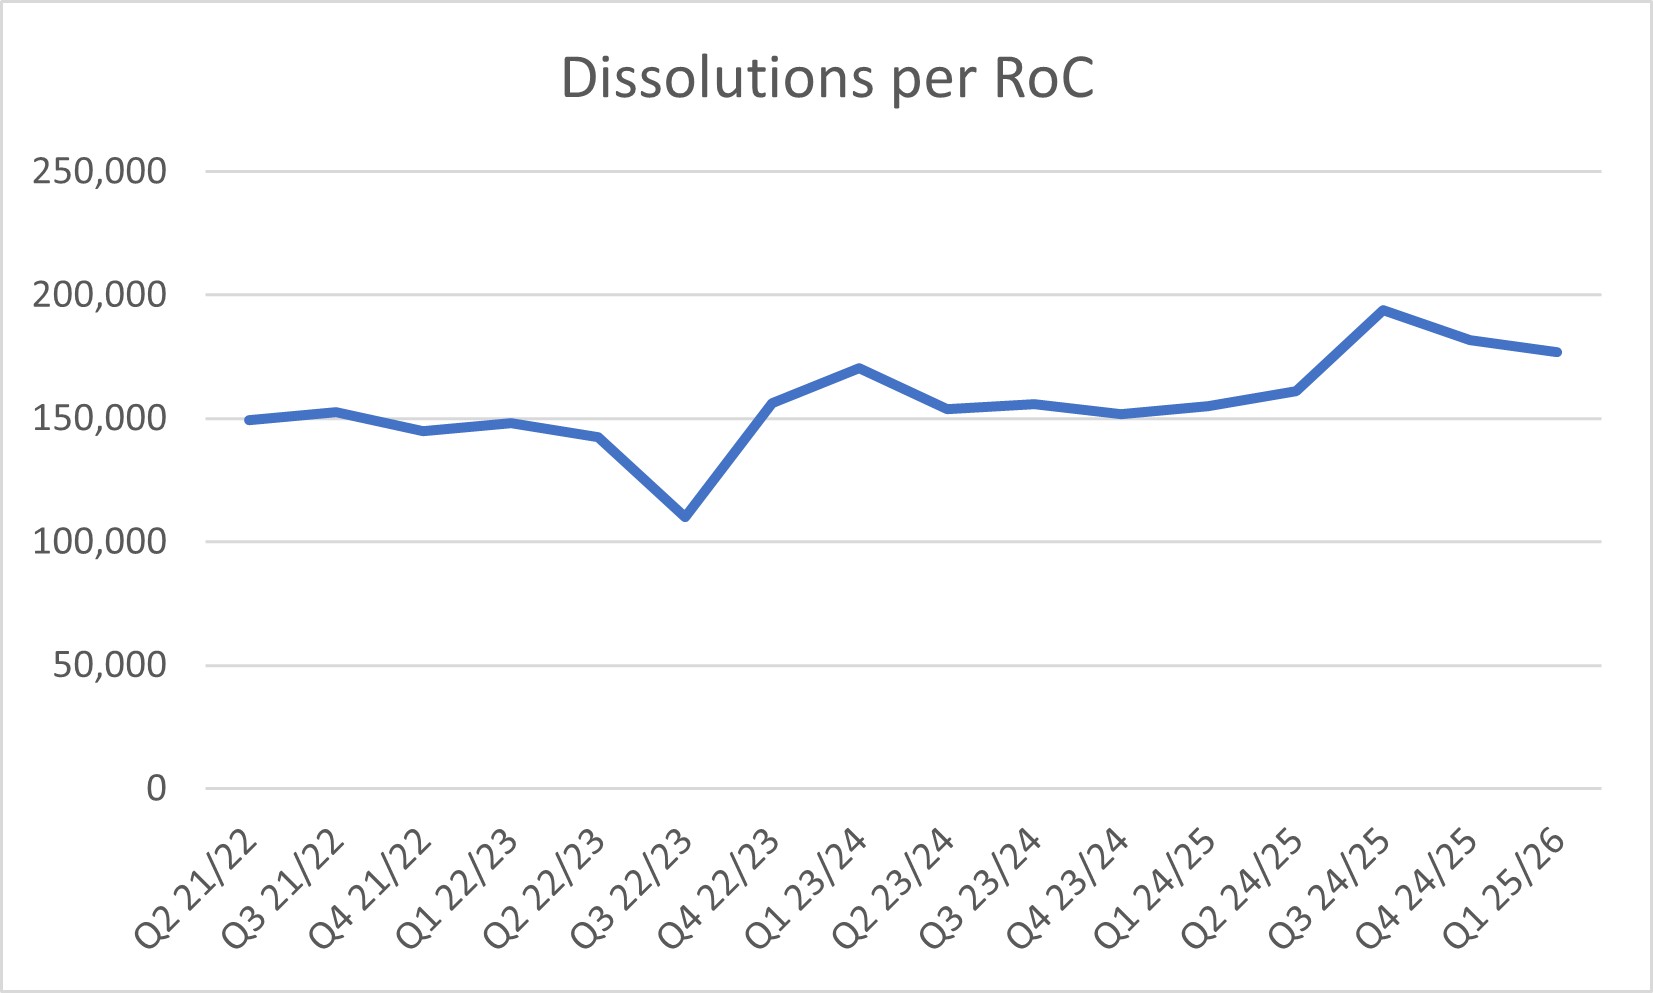
The quarterly figures for dissolutions (voluntary and compulsory) have been drawn from Companies House’s statistics. Liquidations pale into insignificance against the number of dissolutions: over the last four reported quarters, there were 750,000 dissolutions but only c.31,000 liquidations (all types).
The following are the changes over Q4 2025 compared with Q4 2024:
- CVLs: <1% change in Q4 2025 (although the trend since 2023 is a steady decrease as the graph below illustrates)
- MVLs: 50% lower than in Q4 2024 (not surprising given 2024’s spike)
- ADMs: 9% higher
- BKYs: 13% lower (although this quarter included the InsS ISCIS change hiccup on 31 Oct, I would have thought they would have caught up with the backlog, so Q4 25’s lower count presumably does reflect a lower uptake in BKYs)
- WUCs: 21% lower (again, I would have expected the ISCIS interruption to have been overcome in the quarter. It certainly doesn’t feel like there’s less HMRC winding-up activity out there but the graph does suggest a downward trend)
The Insolvency Service’s monthly figures are at https://www.gov.uk/government/collections/company-insolvency-statistics-releases and https://www.gov.uk/government/collections/individual-insolvency-statistics-releases (and pre March-24 stats are at www.gov.uk/government/collections/monthly-insolvency-statistics).

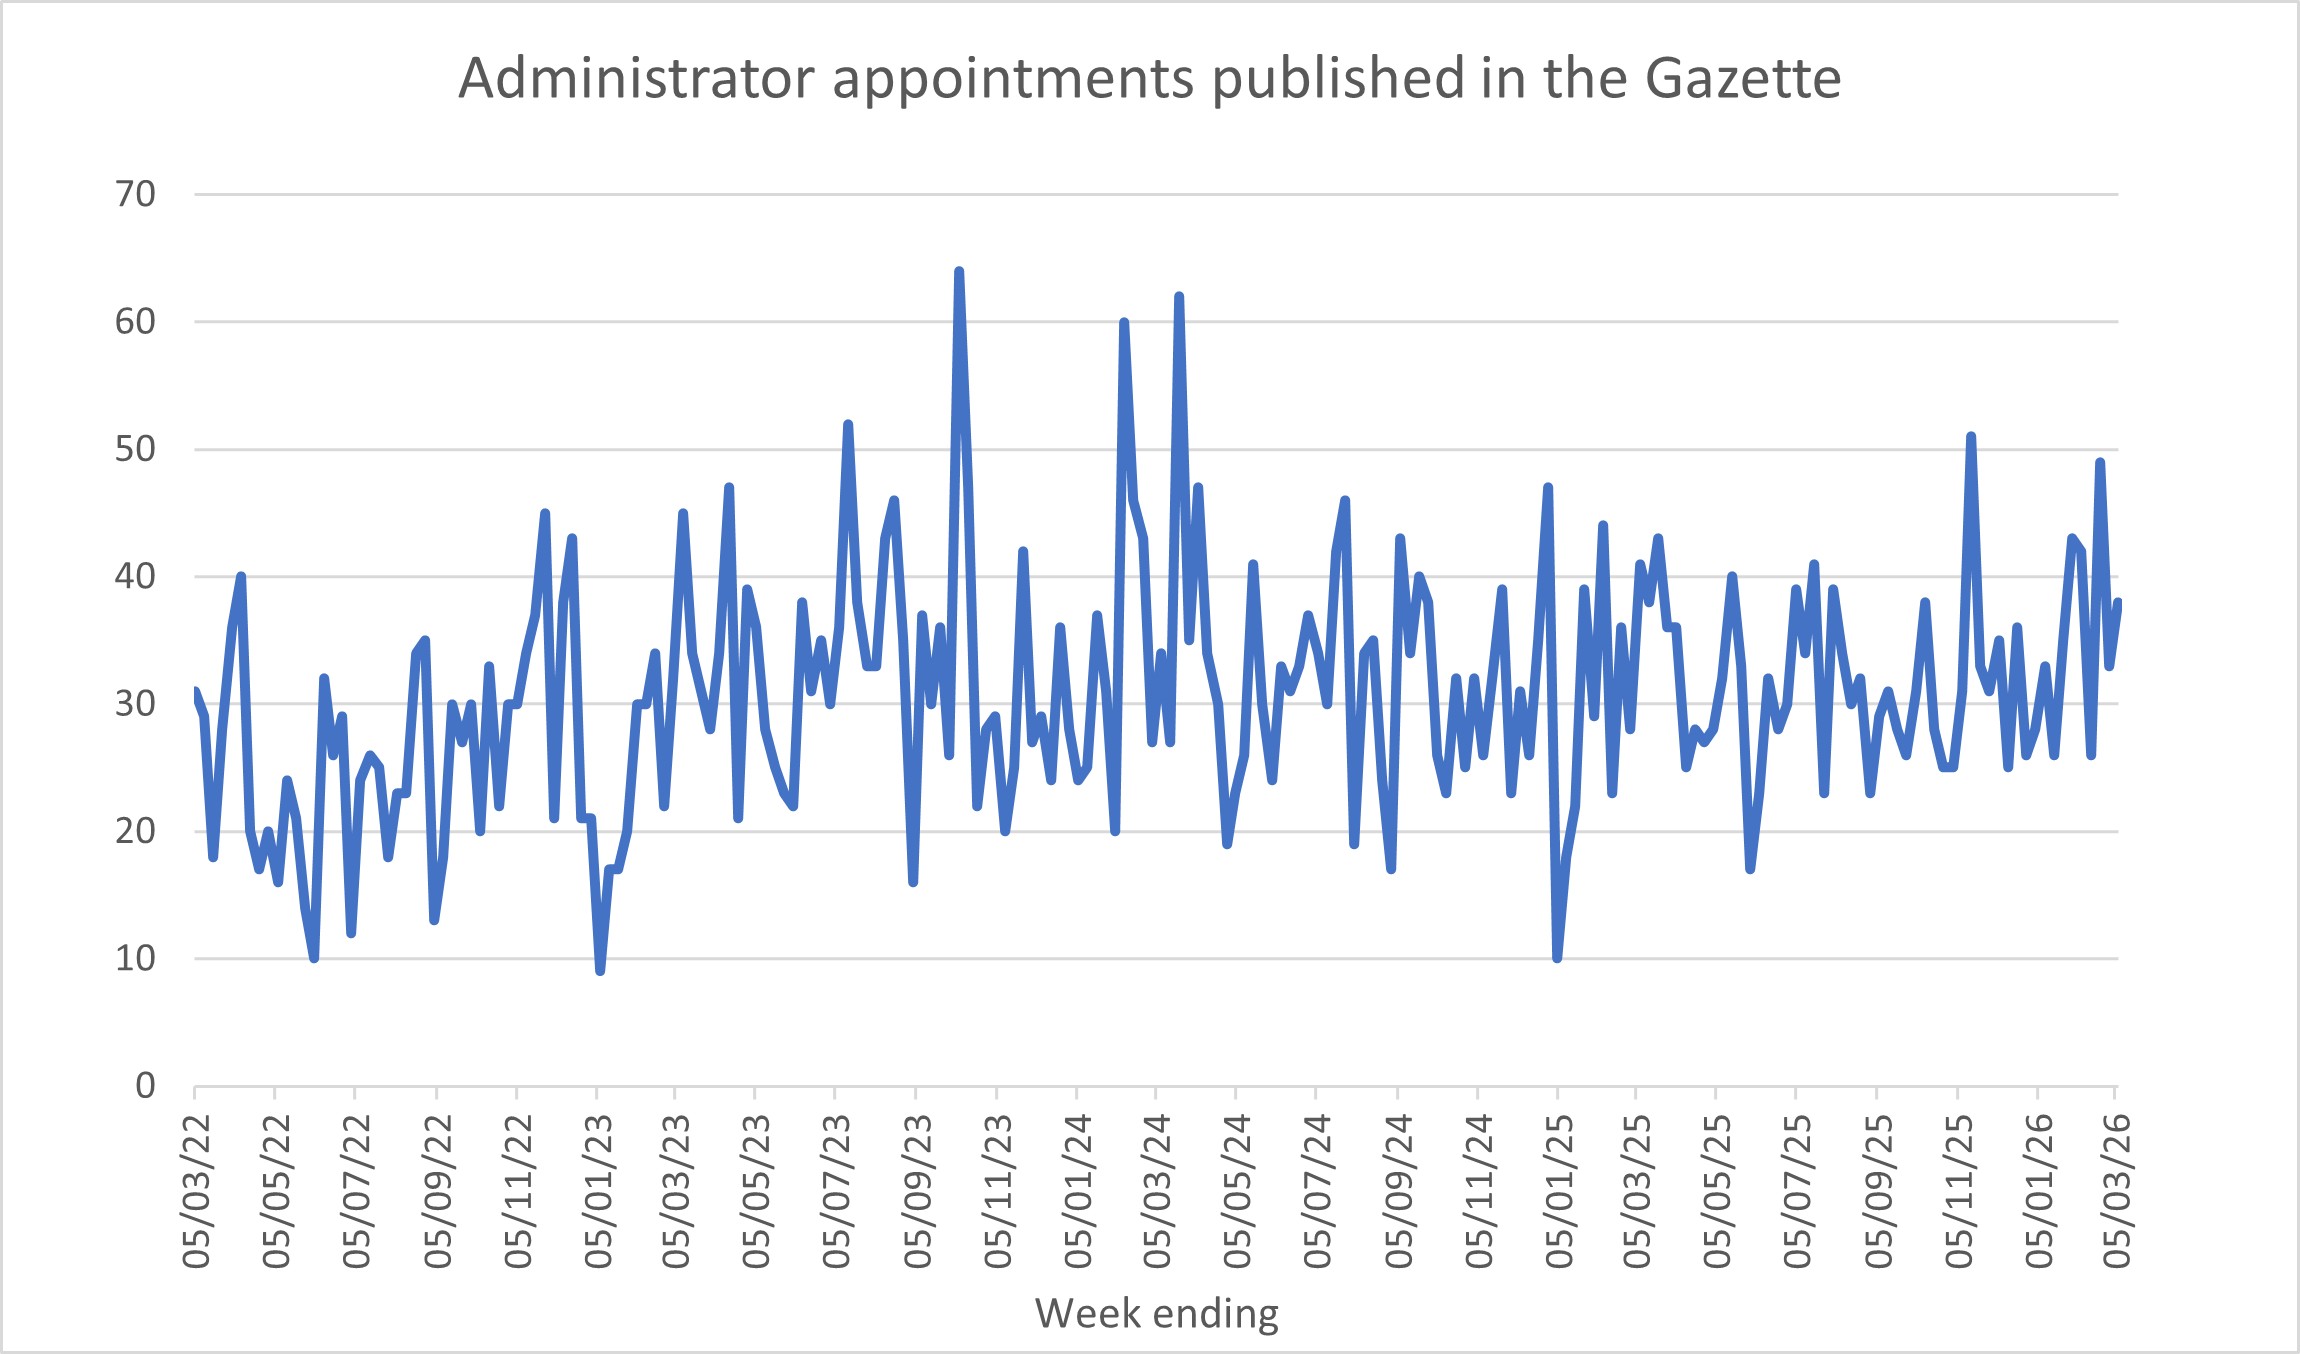
Note: the hike in ADMs over the past two weeks relates to 147 connected ADMs.