
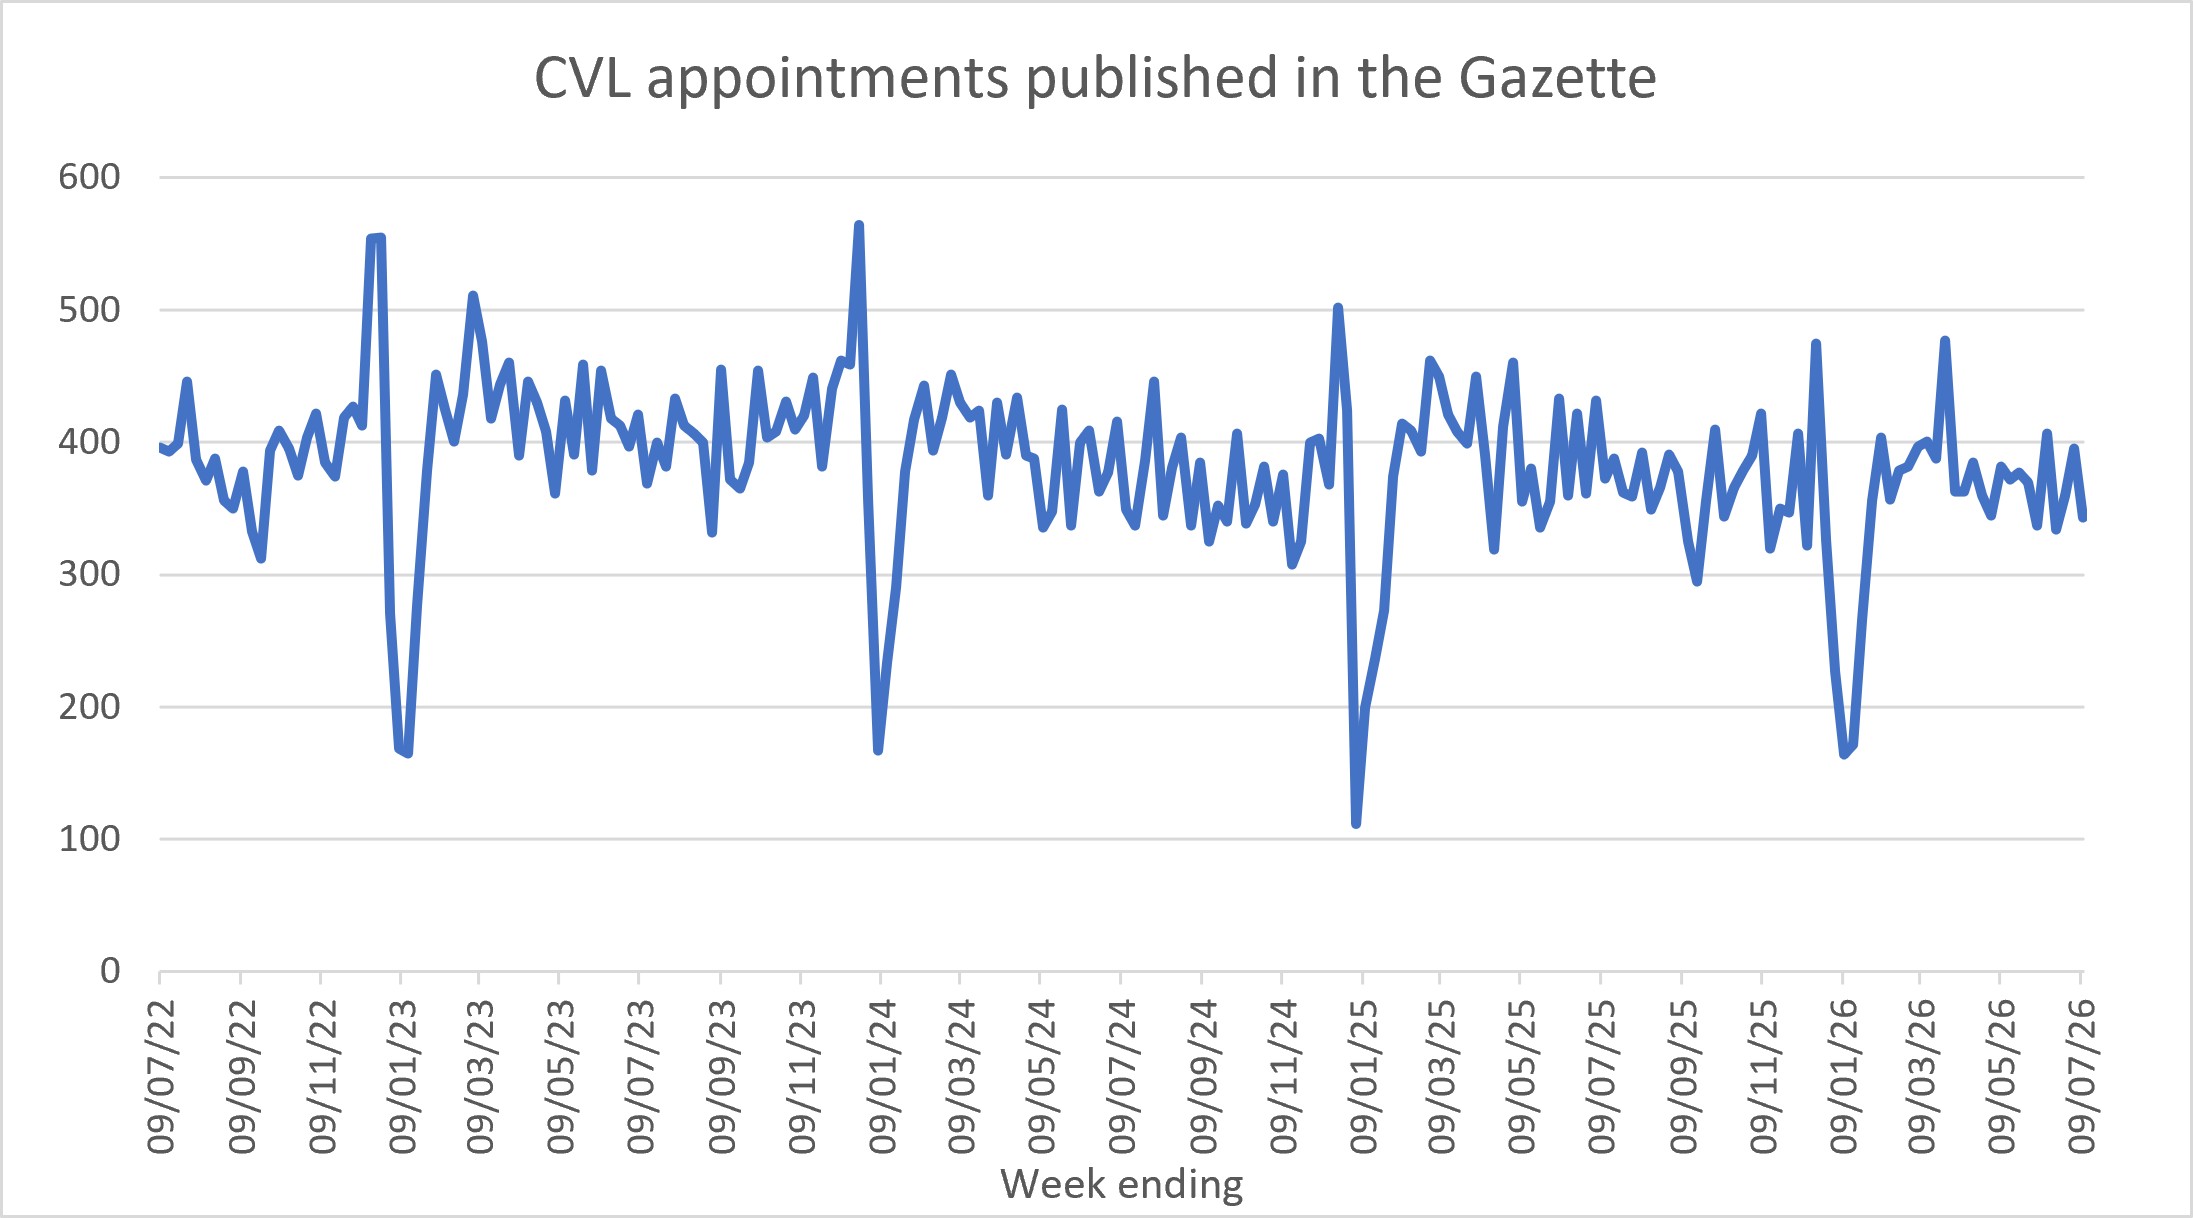
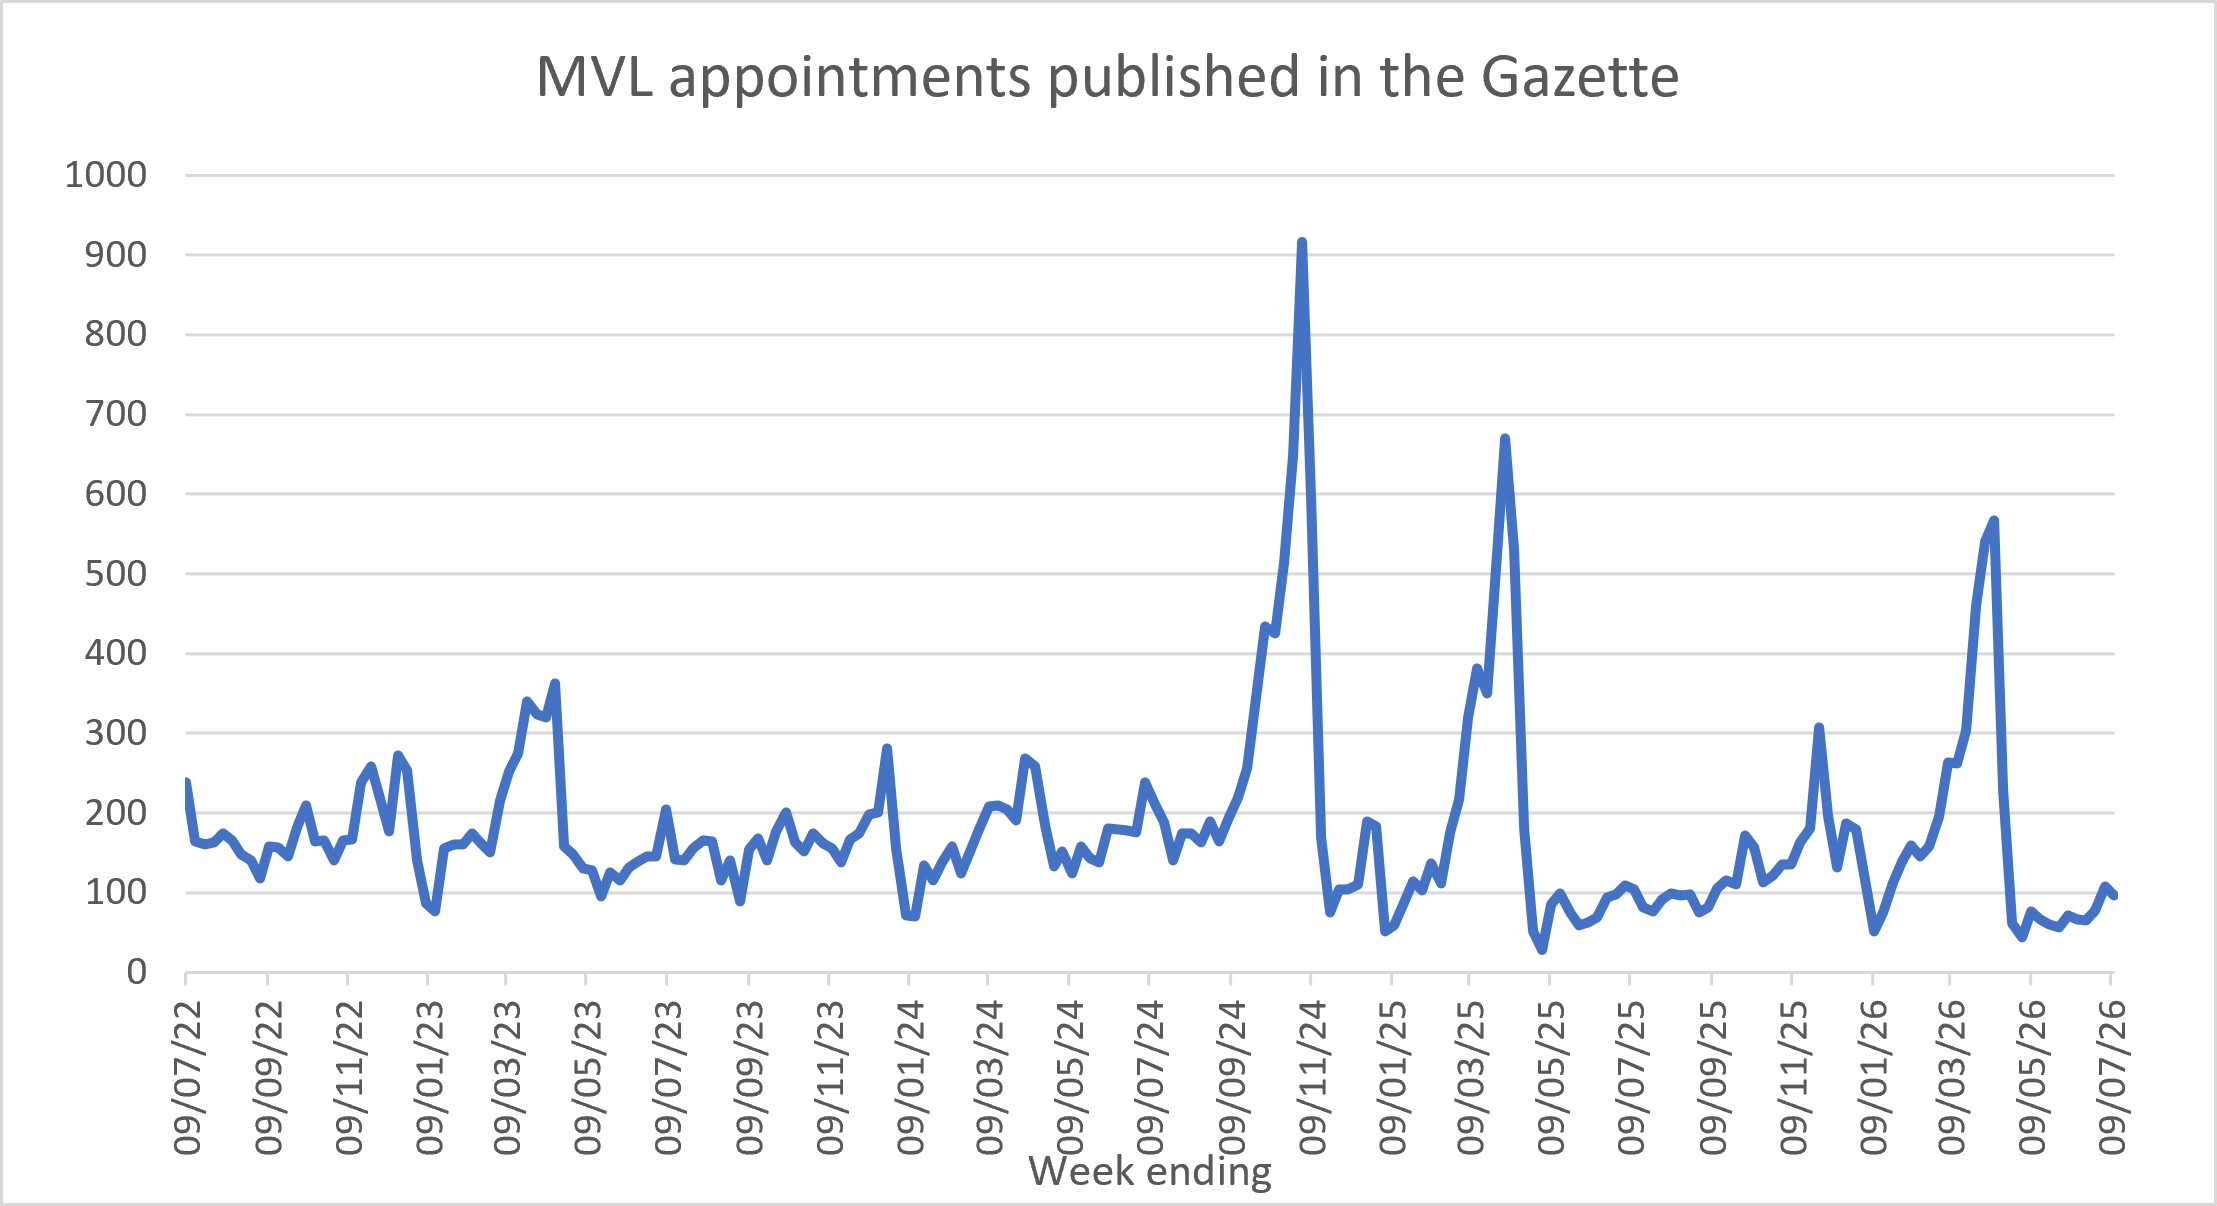
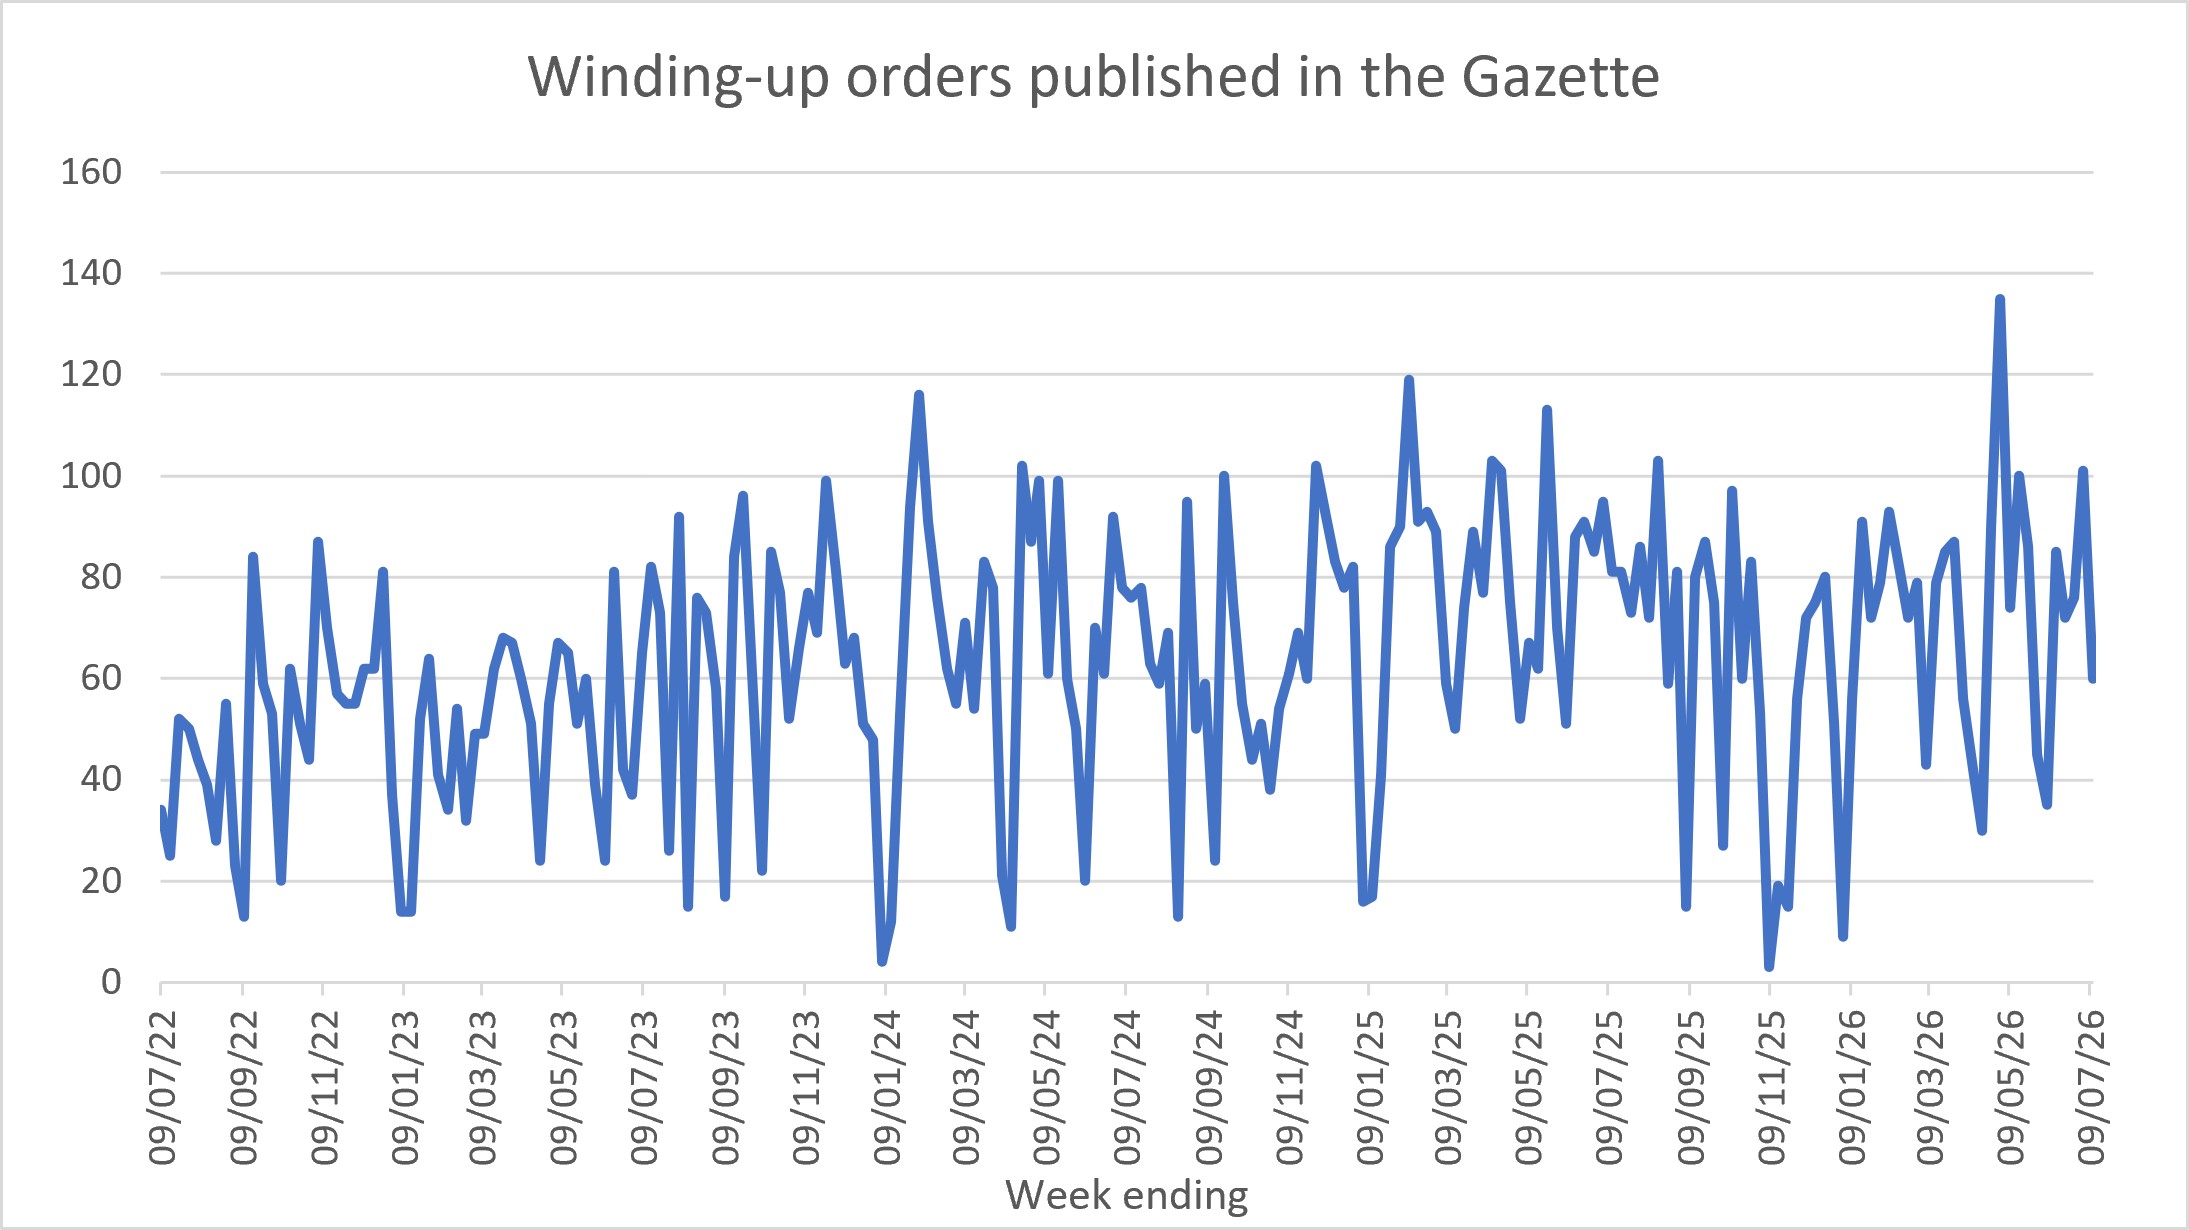
The following graphs show the numbers of notices of appointment published in the Gazette on a weekly basis. Therefore, they likely lag a week or so behind the actual dates of appointment. The graphs are updated each week.
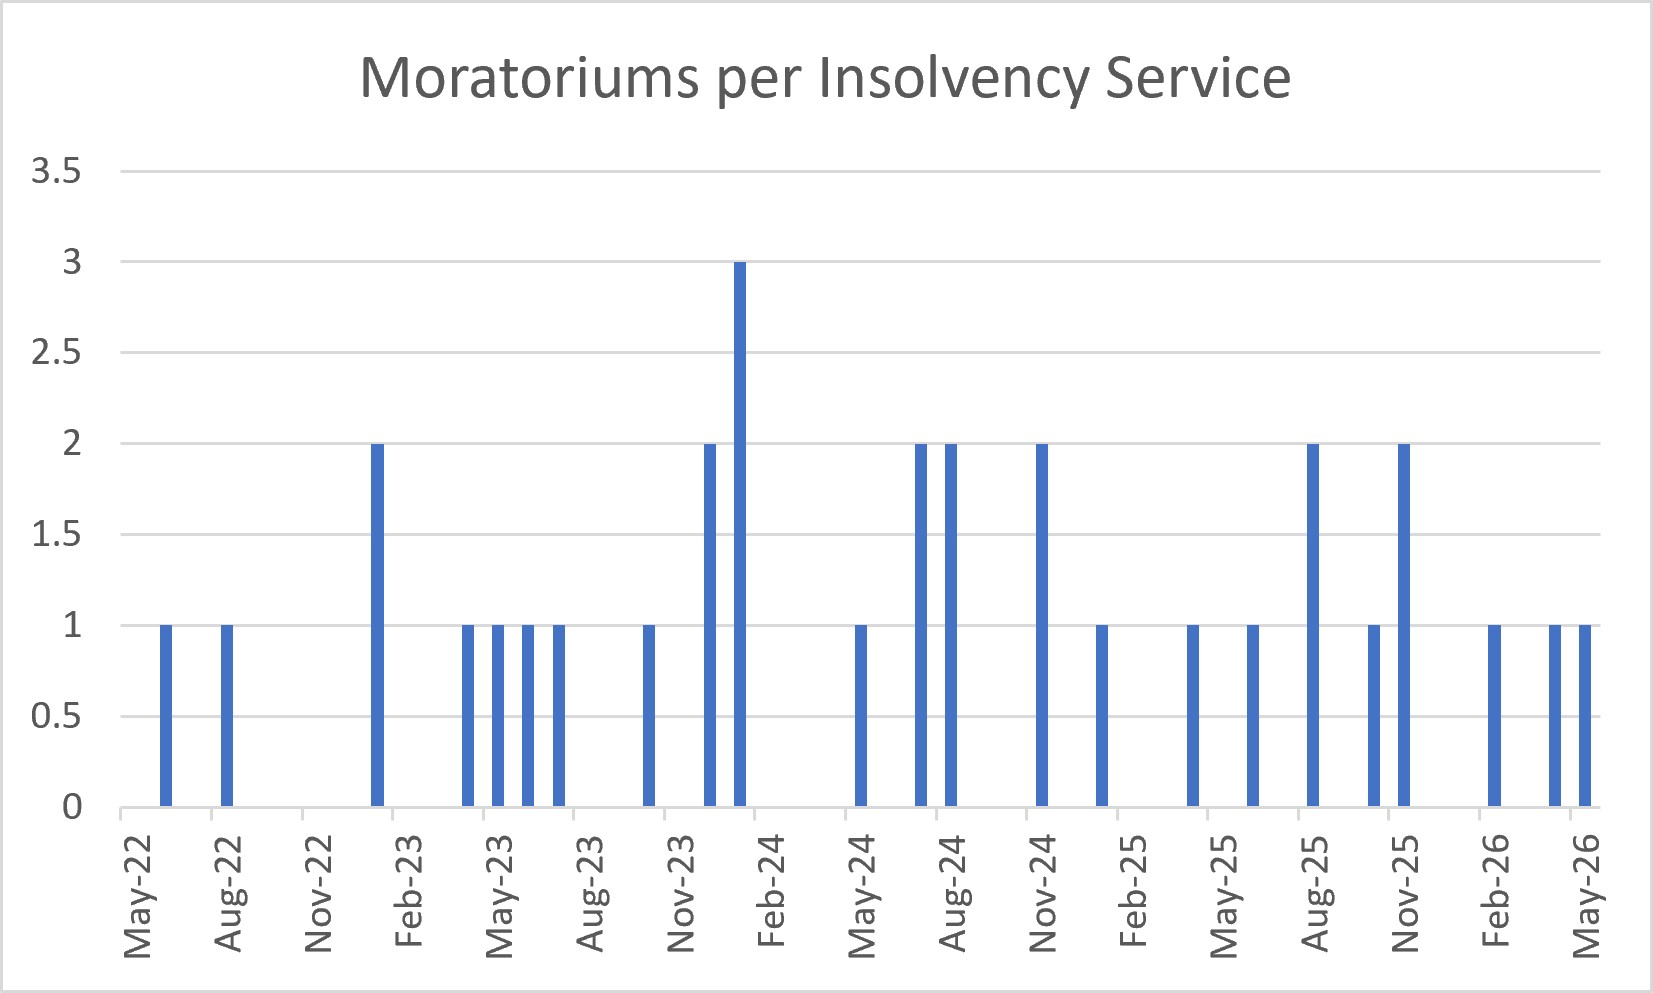
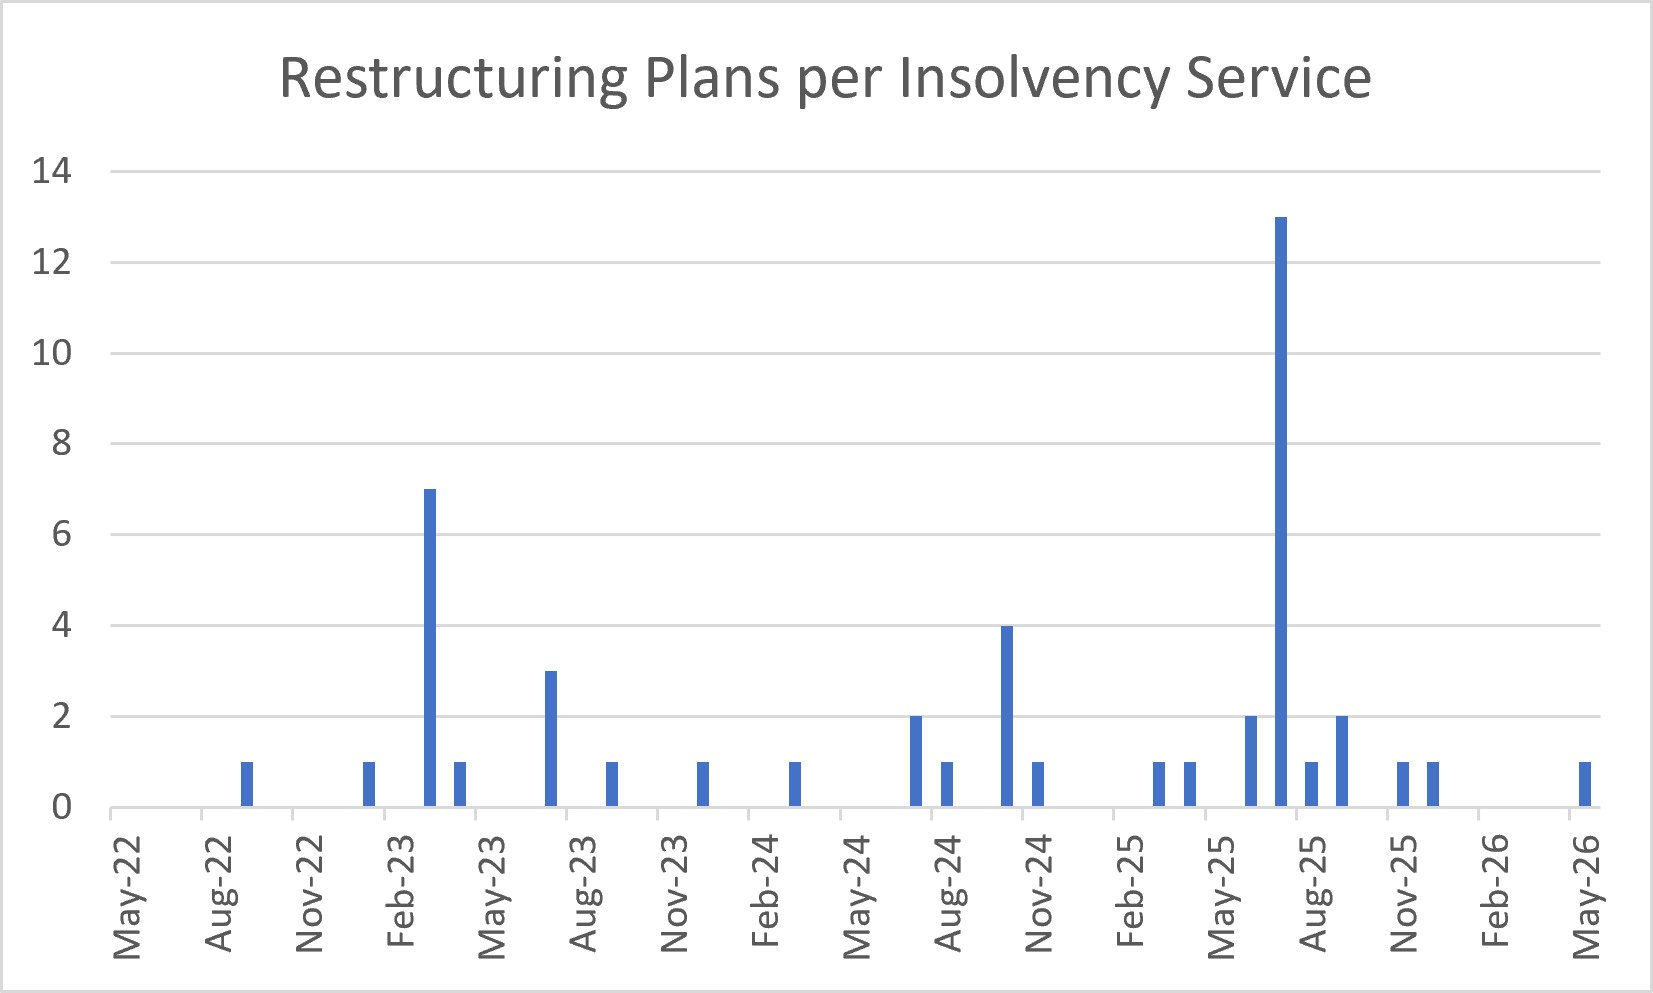
Although there are very few moratoriums and restructuring plans, I thought I might as well provide graphs for those too. I have drawn the data for these from the Insolvency Service’s monthly statistics.
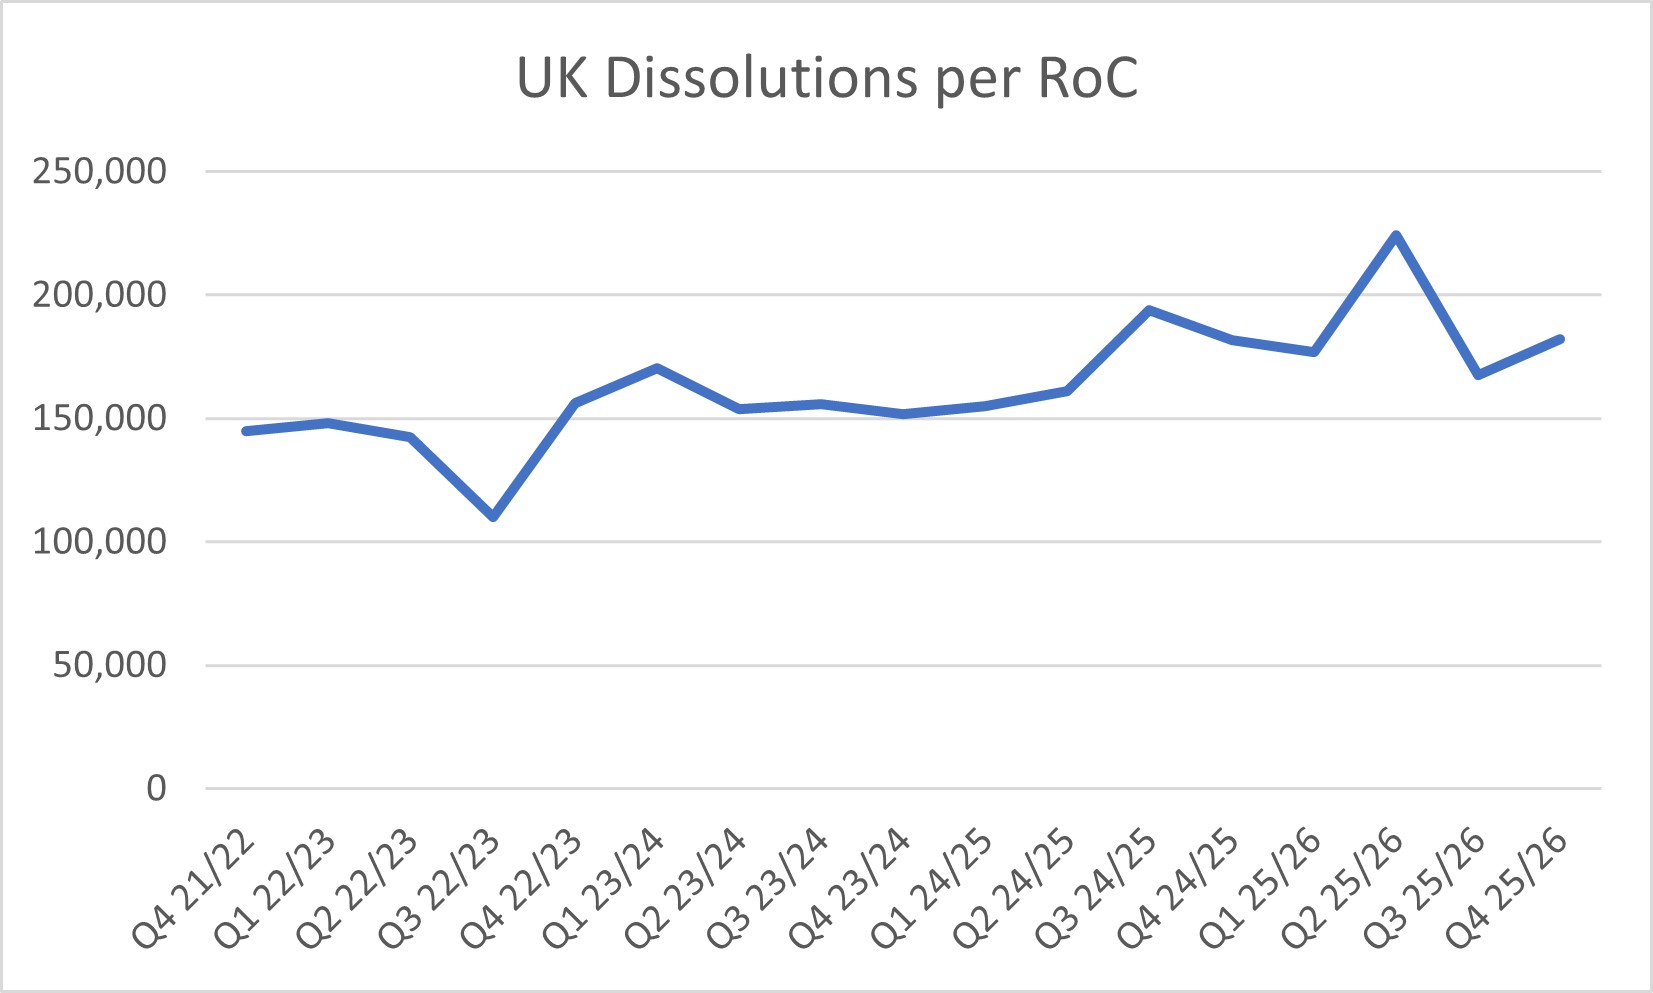
The quarterly figures for dissolutions (voluntary and compulsory) have been drawn from Companies House’s statistics. Liquidations pale into insignificance against the number of dissolutions: over the last four reported quarters, there were 750,000 dissolutions but only c.31,000 liquidations (all types).
The following are the figures for Q2 2026 compared with Q2 2025:
- CVLs: 5% drop in Q2 2026
- MVLs: 26% down from Q2 2025
- ADMs: there were 75 Gazette notices for connected appointments in Q2 2026. These skew the increase to 36% in Q2 2026. However, even removing this blip, Q2 2026 is 16% higher than Q2 2025
- BKYs: 18% higher in Q2 2026
- WUCs: 6% lower in Q2 2026
The Insolvency Service’s monthly figures are at https://www.gov.uk/government/collections/company-insolvency-statistics-releases and https://www.gov.uk/government/collections/individual-insolvency-statistics-releases (and pre March-24 stats are at www.gov.uk/government/collections/monthly-insolvency-statistics).
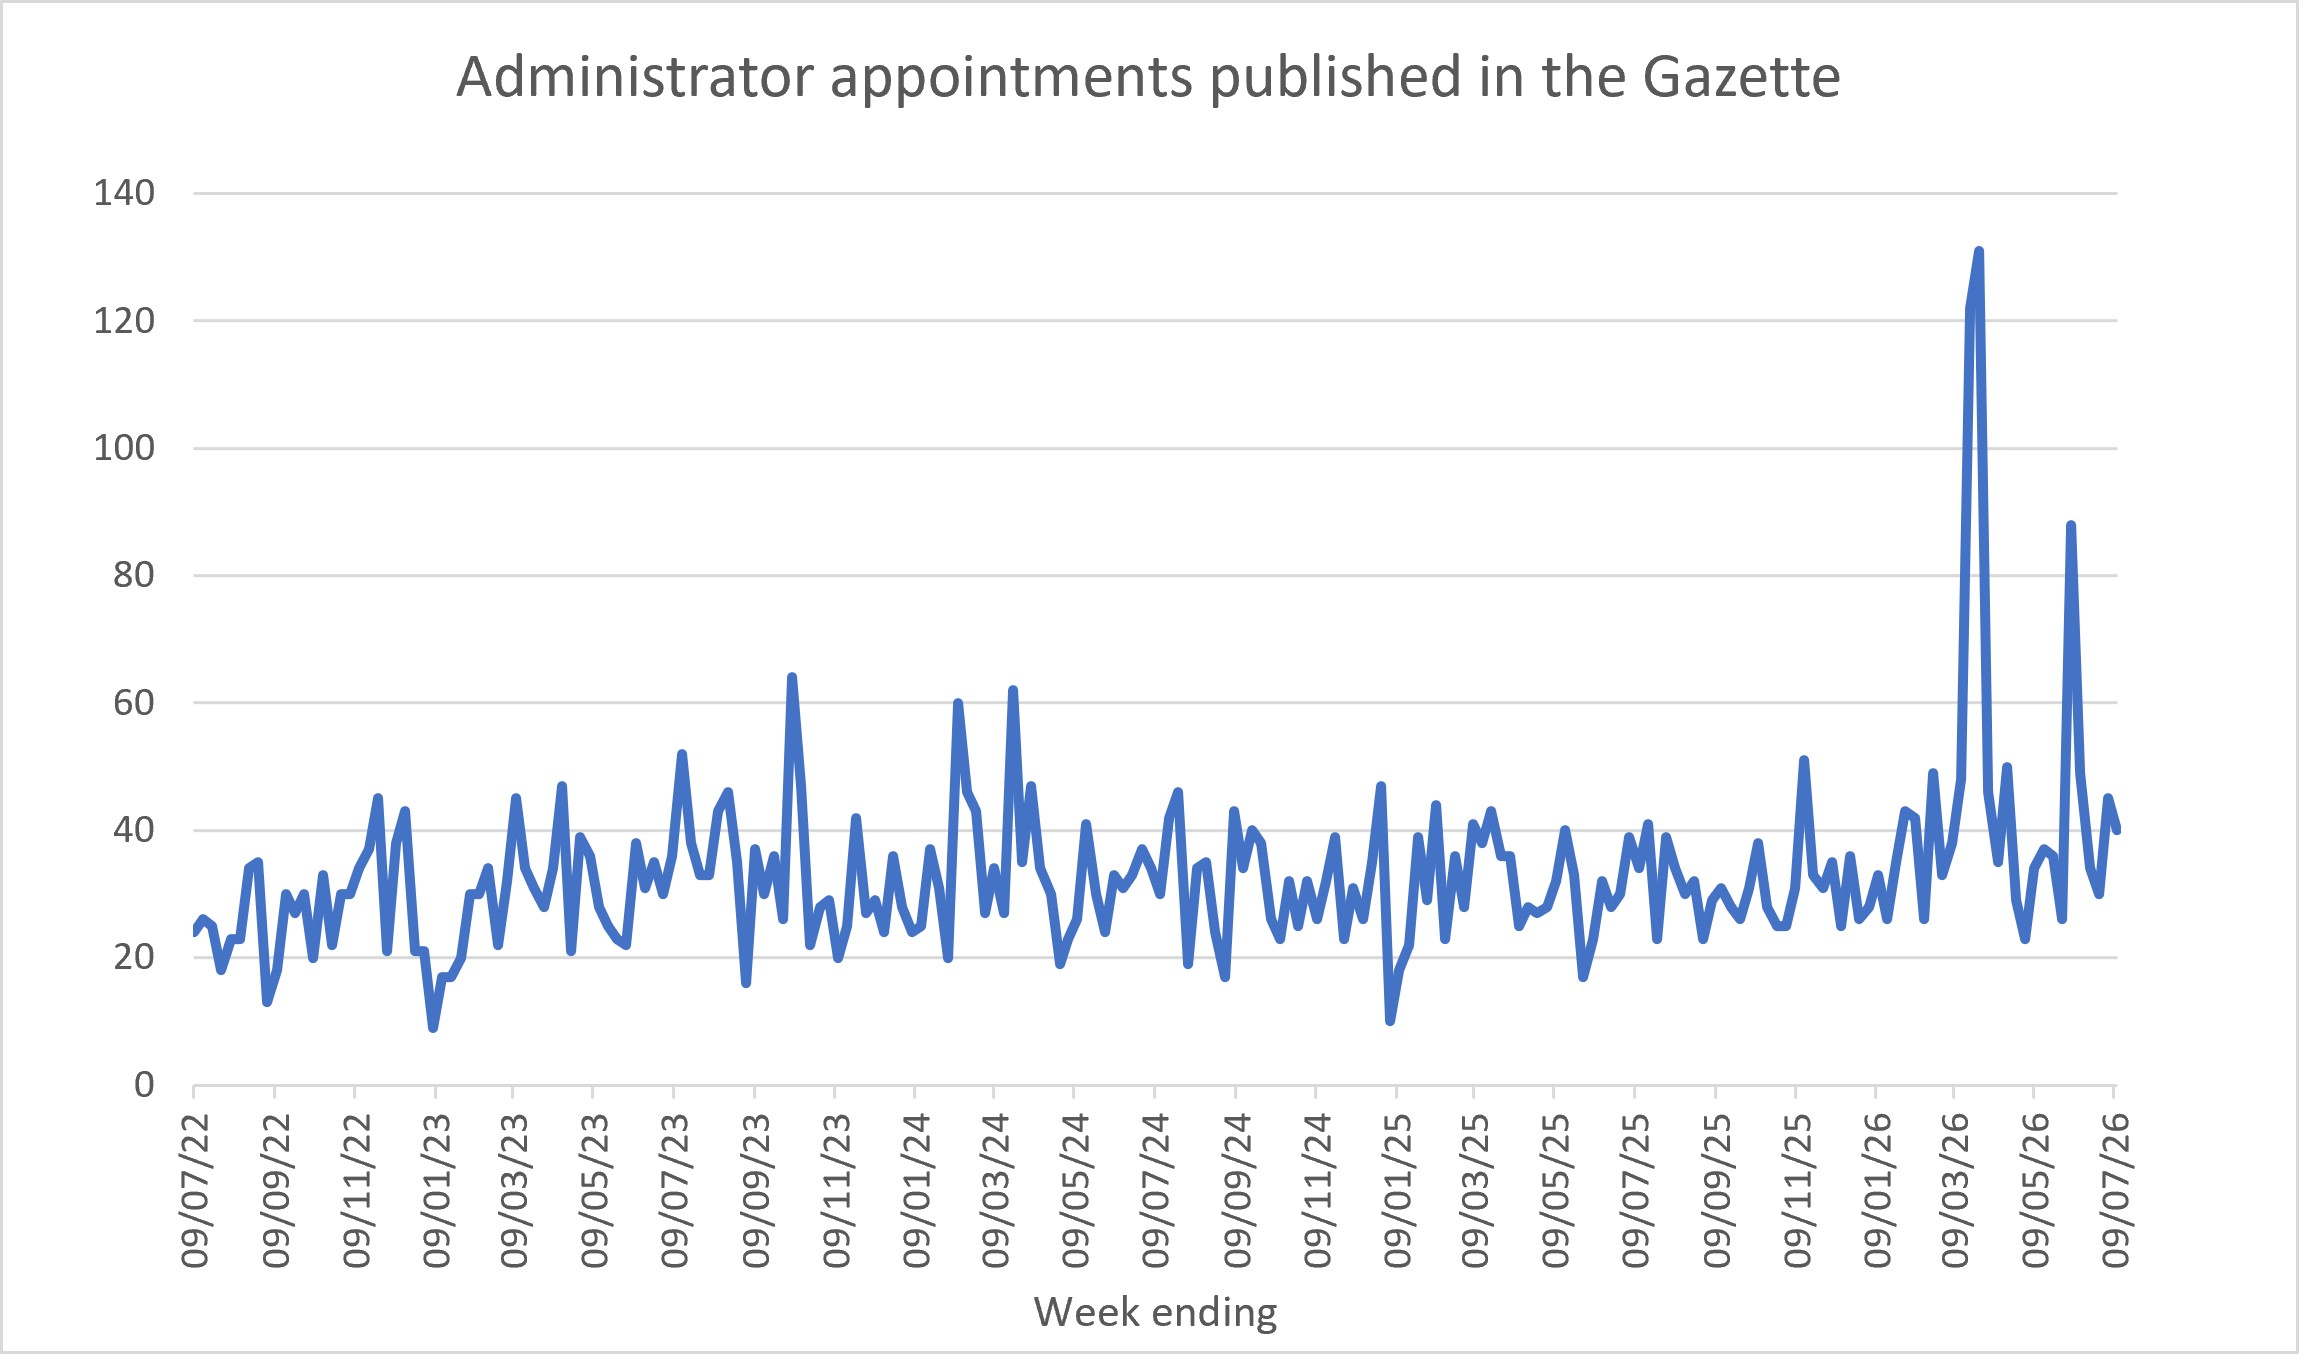
Note: the recent spikes in ADMs relate to c.230 connected appointments.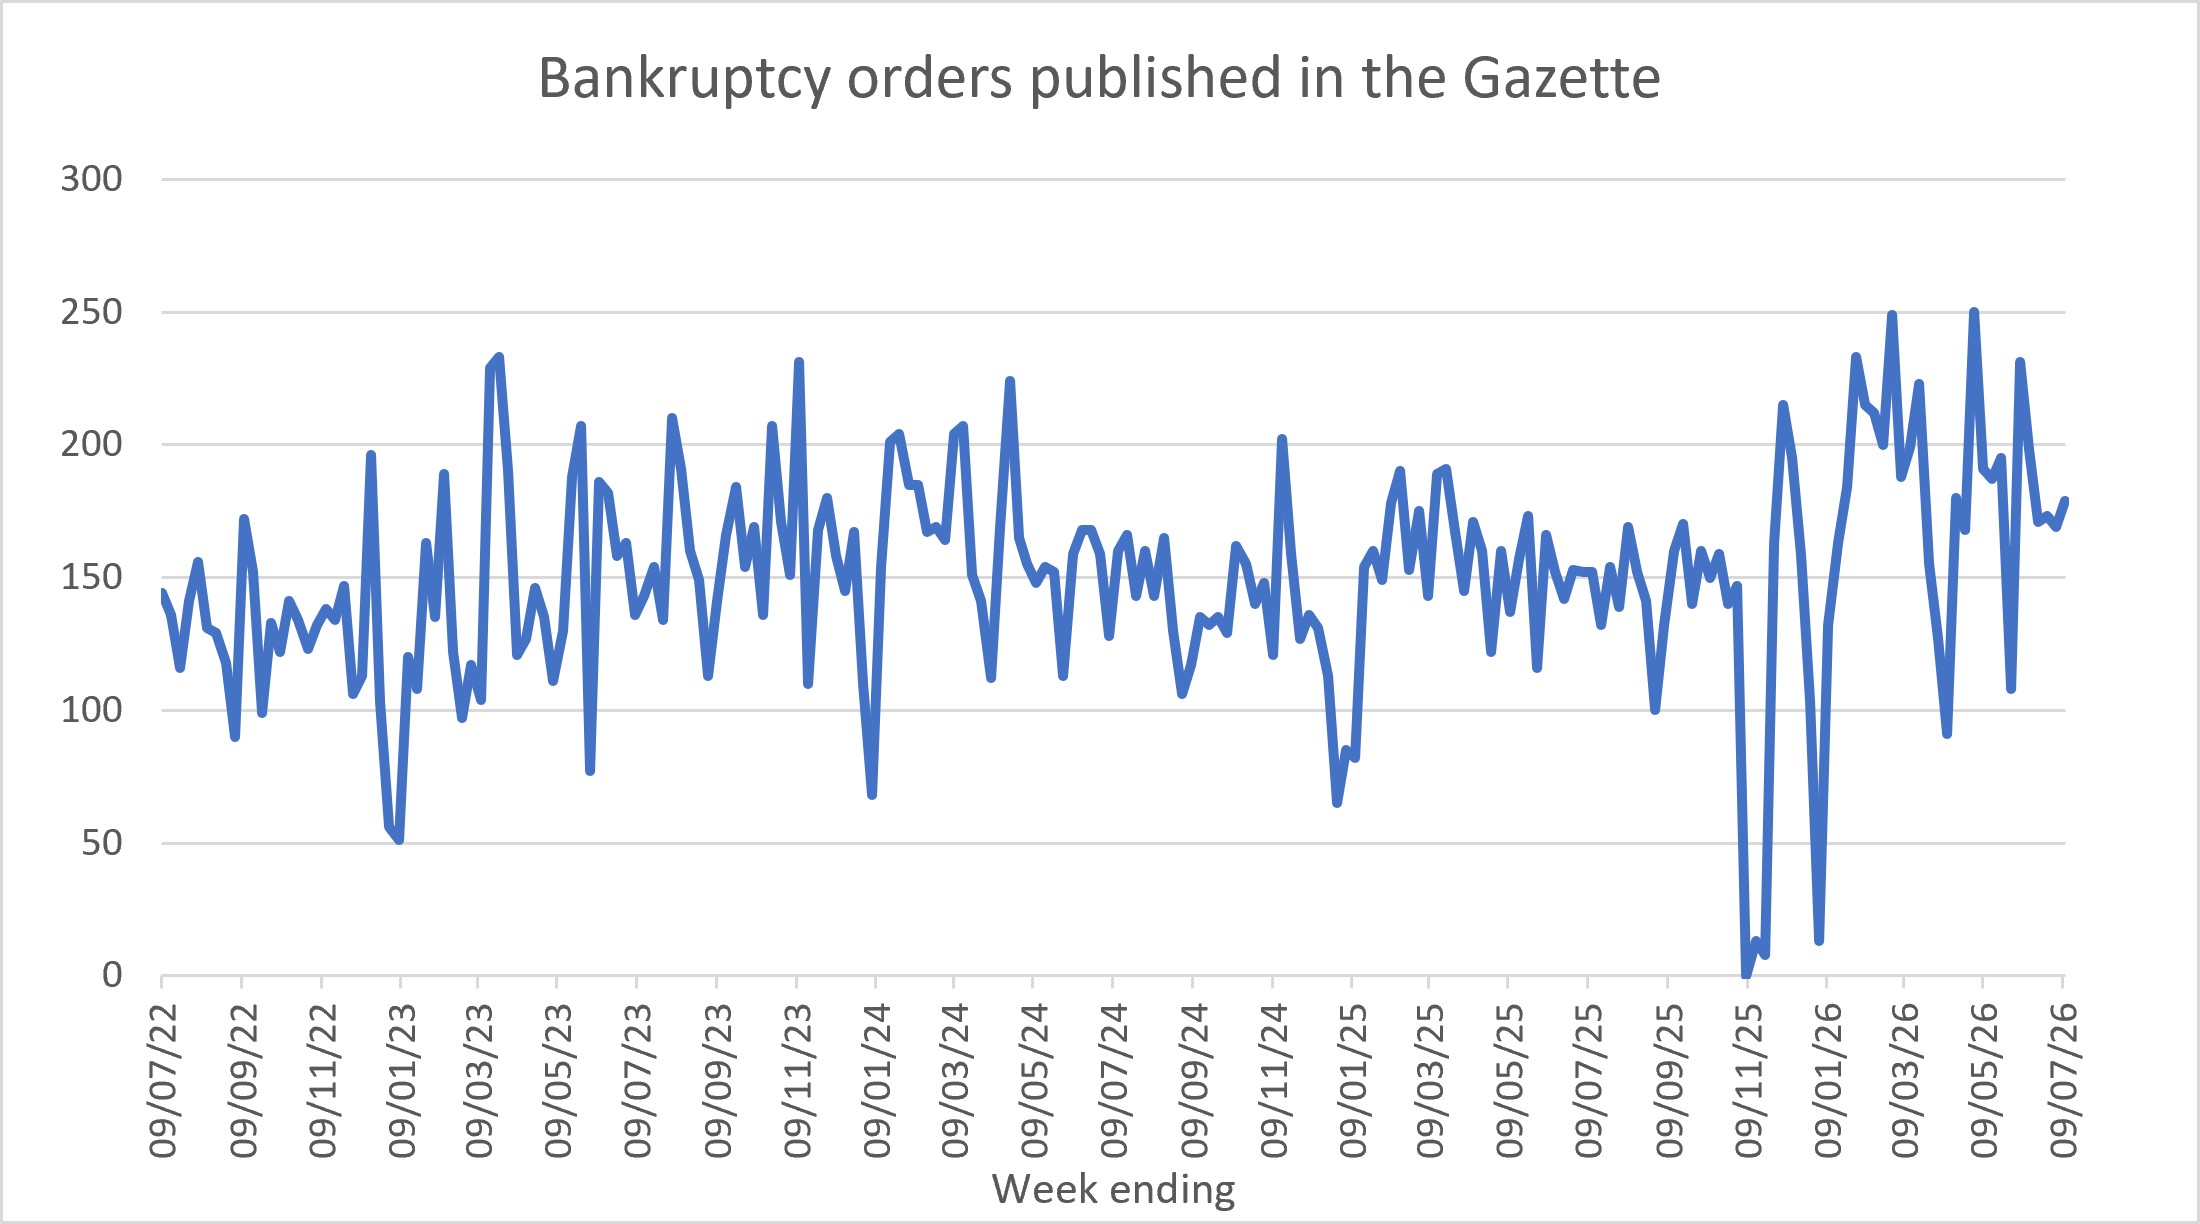